Summary
- The USA’s 20 busiest airports have 78% of the country’s flights, with services 5% lower than in July 2019.
- Five airports have lost 100+ daily departures, with Chicago O’Hare down by 239.
- Detroit has lost nearly one in four outbound flights.
It feels like a long time since COVID-19 significantly disrupted the world. Despite this, things continue to recover – not everything has returned to the pre-pandemic level, let alone exceeded it. This is even true of flights from the USA’s 20 busiest airports.
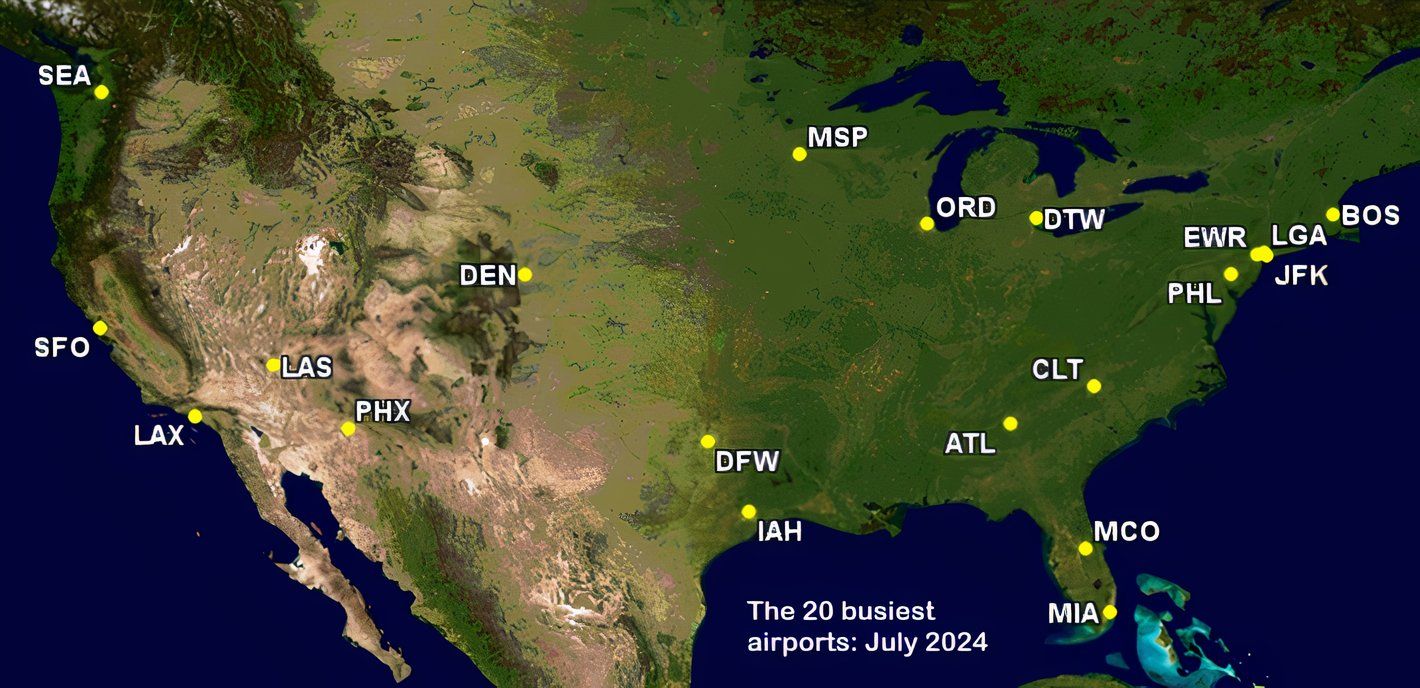
The country’s 20 busiest airports
The following map shows them. When combined, Cirium data indicates that they have 412,350 July departures. In other words, they have an average of 13,300 daily one-way flights. They are so busy and influential that almost eight in 10 of the country’s flights are to/from them (78%).
Image: GCMap
However, services are 5% lower than in July 2019, before the pandemic. The situation is generally about the same as in the whole US. The 20 airports have lost a net of approximately 19,500 monthly and 630 daily departures.
The situation is different for other measures. When seats for sale are considered, the 20 airports have grown by 6%, helped by seats per flight increasing from 137 to 152. Meanwhile, available seat miles (ASMs; miles x distance) have risen by 4%.
Related
Up To 2h 44m: The USA’s 10 Longest 50-Seat Regional Jet Flights In July
Which do you think made the cut?
The 10 airports with fewer flights
The following table summarizes them. Again, this is only based on departures and, therefore, activity. The results might be different for available seats and ASMs.
Related
The Top 10 Foreign Airlines Serving The US Have Nearly 600 Daily Flights
Which airlines do you think made the cut?
Five airports have lost 100+ daily departures, particularly Chicago O’Hare, the US and the world’s third-busiest airport. It is down by 239 daily departures (-18%). Of course, this is just an average; it will vary on the specific day.
Southwest’s O’Hare services have reduced by a third, American’s by a quarter, and United’s by a fifth. They have prioritized growth elsewhere and suffered from reduced business travel and other changes, while Southwest has fewer aircraft than expected.
For space reasons, the 10 airports that have grown will be covered separately.
|
US ranking* |
World ranking** |
Airport |
% flight change: July 2024 vs. July 2019 |
Avg. change in daily departures* |
|---|---|---|---|---|
|
20 |
54 |
Detroit |
-23% |
-127 |
|
15 |
30 |
San Francisco |
-19% |
-123 |
|
6 |
6 |
Los Angeles International |
-18% |
-169 |
|
3 |
3 |
Chicago O’Hare |
-18% |
-239 |
|
19 |
50 |
Philadelphia |
-16% |
-84 |
|
18 |
43 |
Minneapolis |
-15% |
-81 |
|
1 |
1 |
Atlanta |
-13% |
-167 |
|
12 |
25 |
Newark |
-5% |
-32 |
|
17 |
34 |
New York LaGuardia |
-3% |
-14 |
|
9 |
18 |
Houston Intercontinental |
-2% |
-10 |
|
* July 2024 |
** July 2024 |
* Each way. Flight difference/31 days |
A quick look at Detroit
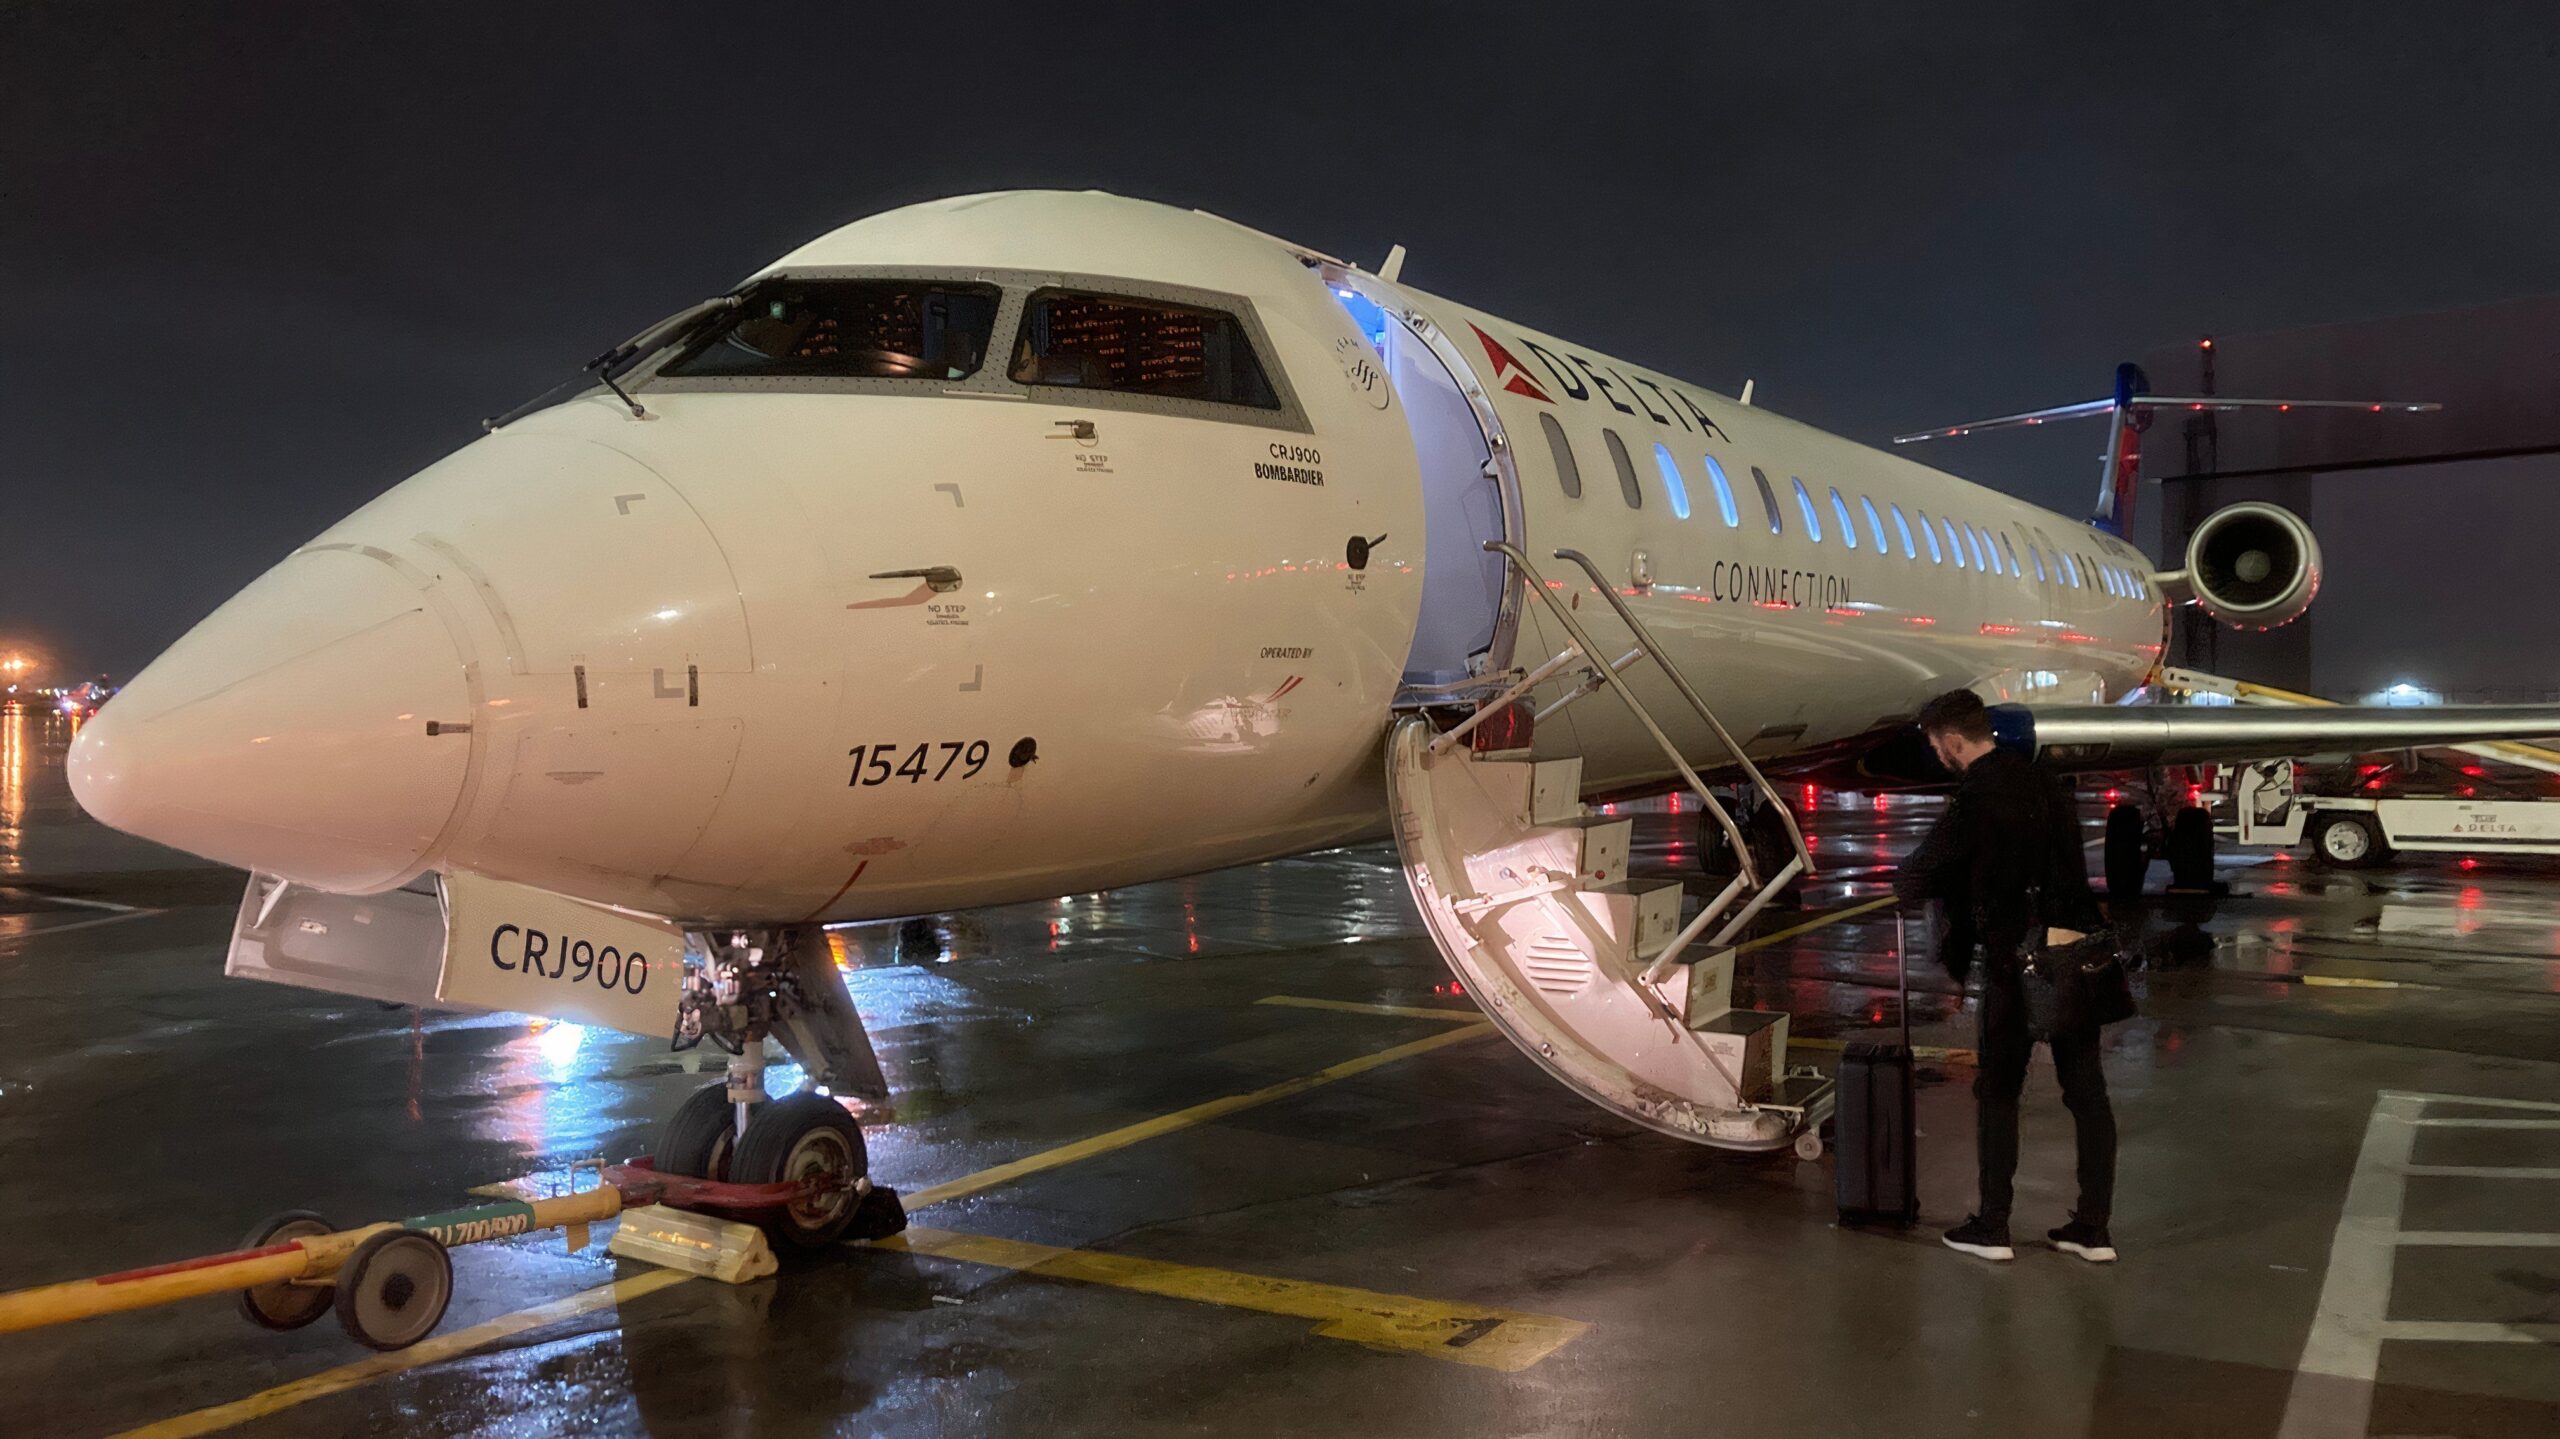
Detroit has lost nearly one in four departures. Unsurprisingly, Delta is very responsible for the decline (-27%) compared to other airlines (-11%).
Delta’s equipment upgauging at Detroit has been considerable. It now has an average of 133 seats per flight, up from 112. As such, seat capacity has reduced far less than flights. Indeed, Delta Connection flights have fallen by half, while all non-regional jets have risen by 1%.
Related
19 Routes: Delta Air Lines & Virgin Atlantic’s London To US Network Explored
The pair have about one in four non-stop London-US services.
The hub is particularly exposed to the country’s industrial heartland, and all that means for the economy and business demand. Delta’s Detroit route map has fallen from 131 non-stop destinations in July 2019 to 107 now. The Michigan airport is the world’s 54th busiest, down from 30th in the pre-pandemic.
