Key Takeaways
- United Airlines shares could remain in focus on Thursday after soaring to their highest level in more than four years today following the full-service carrier topping quarterly estimates.
- The stock has trended higher since breaking out from a 21-month trading range last month and with the shares on track to record their highest weekly volume since mid-July, indicating strong buying conviction.
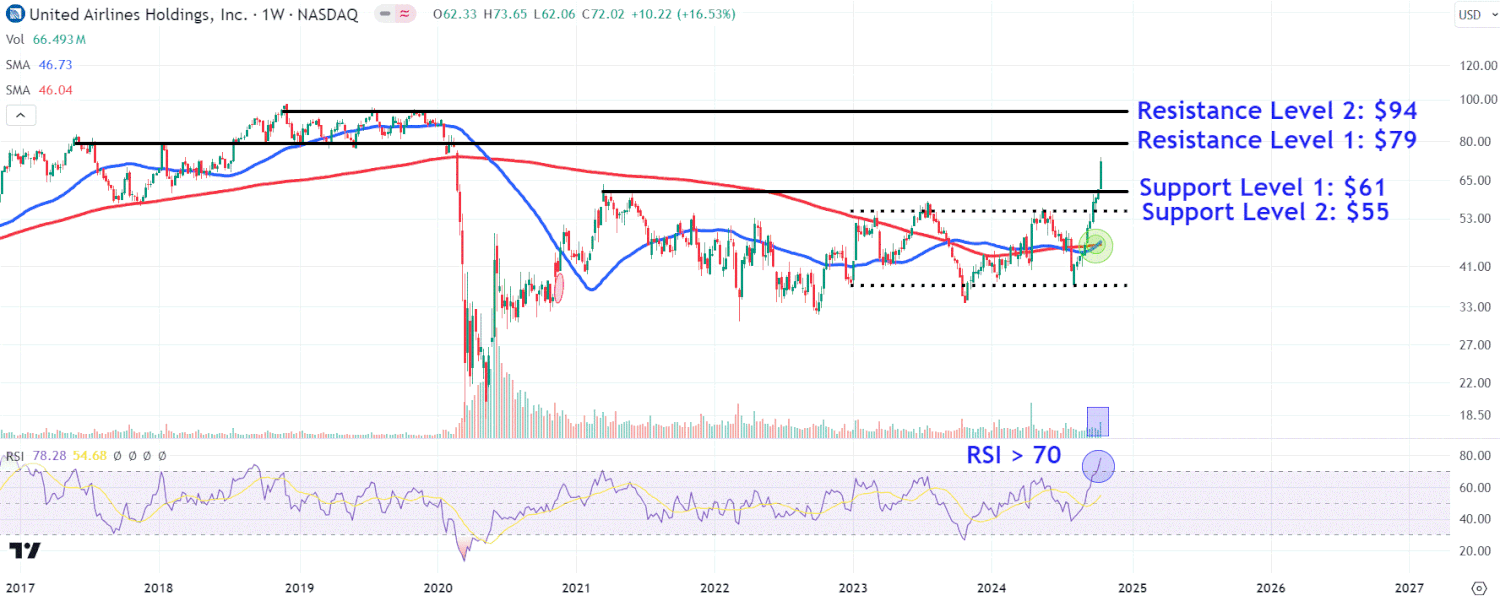
- Investors should monitor key resistance levels on United’s chart around $79 and $94, while also watching important support levels near $61 and $55.
United Airlines (UAL) shares could remain in focus on Thursday after soaring to their highest level in more than four years today as the full-service carrier topped quarterly estimates, issued an upbeat profit outlook, and announced a $1.5 billion share buyback program—its first since the pandemic.
The Chicago-based airline also addressed concerns of a summer seat supply glut that led to discounted fares, saying that unprofitable capacity had exited the market during the quarter, leading to an inflection point in revenue and demand. United shares have nearly doubled since their early August low and gained around 75% year-to-date (YTD) through Wednesday’s close.
Below, we’ll take a closer look at United’s weekly chart and use technical analysis to point out important price levels investors may be watching.
Trading Range Breakout
United Airlines shares fluctuated within a 21-month trading range before staging a breakout last month.
Since that time, the price has continued to trend sharply higher, with Wednesday’s earnings-driven surge putting the stock on track to record its highest weekly volume since mid-July, indicating strong buying conviction. Moreover, the 50-week moving average (MA) crossed above the 200-week MA earlier this month to form a golden cross, a chart pattern that signals a potential new uptrend.
However, while the relative strength index (RSI) confirms bullish price momentum with a reading above 70, the indicator also flashes extreme overbought conditions in the stock, which could lead to short-term profit taking.
Let’s look at several key resistance levels that could come into play if the stock continues its ascent and also identify a couple of important support price thresholds to watch during pullbacks.
Key Resistance Levels to Watch
Ongoing earnings momentum could see the shares climb to the $79 level, where they could face head winds from a horizontal line that connects a series of peaks and troughs that formed between May 2017 and February 2020.
A breakout above this level may fuel a move to around $94, a region where investors could look to lock in profits near a series of closely aligned peaks that formed on the chart from December 2018 to November 2019.
Important Support Levels to Monitor
A wave of profit taking could see the shares fall to the $61 level, a location on the chart where they may attract buying interest near prominent pandemic-era swing highs in March and June of 2021.
Further selling may lead to the airline’s stock revisiting key support at $55, where it would likely encounter buying interest near the initial mid-September breakout point around the prior trading range’s top trendline.
The comments, opinions, and analyses expressed on Investopedia are for informational purposes only. Read our warranty and liability disclaimer for more info.
As of the date this article was written, the author does not own any of the above securities.

