Summary
- Airline passenger traffic continues to increase, with August seeing a 28.4% increase compared to 2022.
- International traffic has rebounded strongly, with a 50% increase compared to last year, and international ticket sales for the rest of the year are strengthening.
For the last few years, any discussion around passenger demand or airline capacity has made comparisons to 2019 levels as the benchmark. With post-pandemic recovery nearing completion, the focus is shifting to meeting today’s demand rather than looking backwards and leading that charge is IATA’s Director General Willie Walsh.
Yesterday, the International Air Transport Association (IATA) released its Air Passenger Market Analysis for August, which showed that the positive trend for airline passenger traffic continued last month. The total traffic, as measured by revenue passenger kilometers (RPKs), increased by 28.4% compared to August 2022, and global traffic is now at 95.7% of pre-pandemic levels.
Seat capacity (available seat kilometers) was again well managed and rose 24.9% year-on-year, pushing the passenger load factor to 84.6%, a gain of 2.3% year-on-year. Walsh said that international traffic has increased by 50% versus last year, and ticket sales data show international bookings strengthening for travel in the last part of this year.
Meeting demand is the challenge
Concerning the results, Willie Walsh said that heading into the last quarter of the year, the airline industry has nearly fully recovered to 2019 demand levels but that the focus is changing.
“The focus has not been on getting back to a specific number of passengers or flights, but rather on meeting the demand by businesses and individuals for connectivity that was artificially suppressed for more than two years.
“Having seen the economic, social, and personal losses when airlines could not fly during the COVID-19 crisis, this industry is determined to secure a sustainable long-term future by achieving net-zero carbon emissions by 2050. We know that our customers want a world in which they can enjoy the freedom to travel sustainably.”
International is catching up now China is back
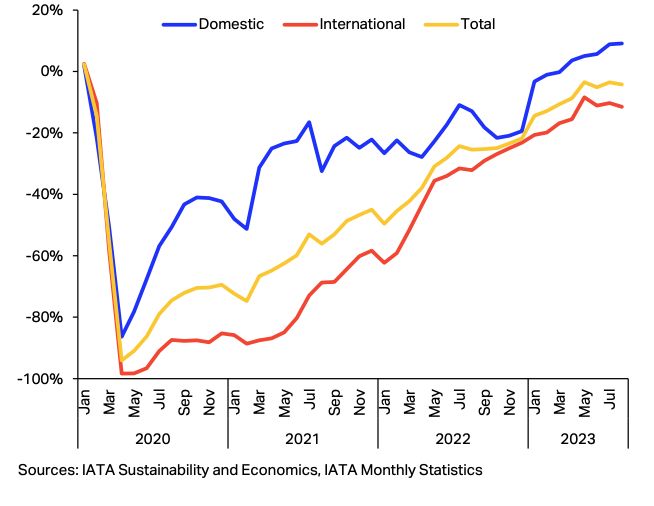
Global domestic traffic, driven mainly by demand in China, grew 25.4% year-on-year and was 9.2% above August 2019, despite disruptions caused by Typhoon Khanun in Japan. International traffic climbed 30.4% YoY, and all markets reported double-digit percentage growth gains compared to 2022.
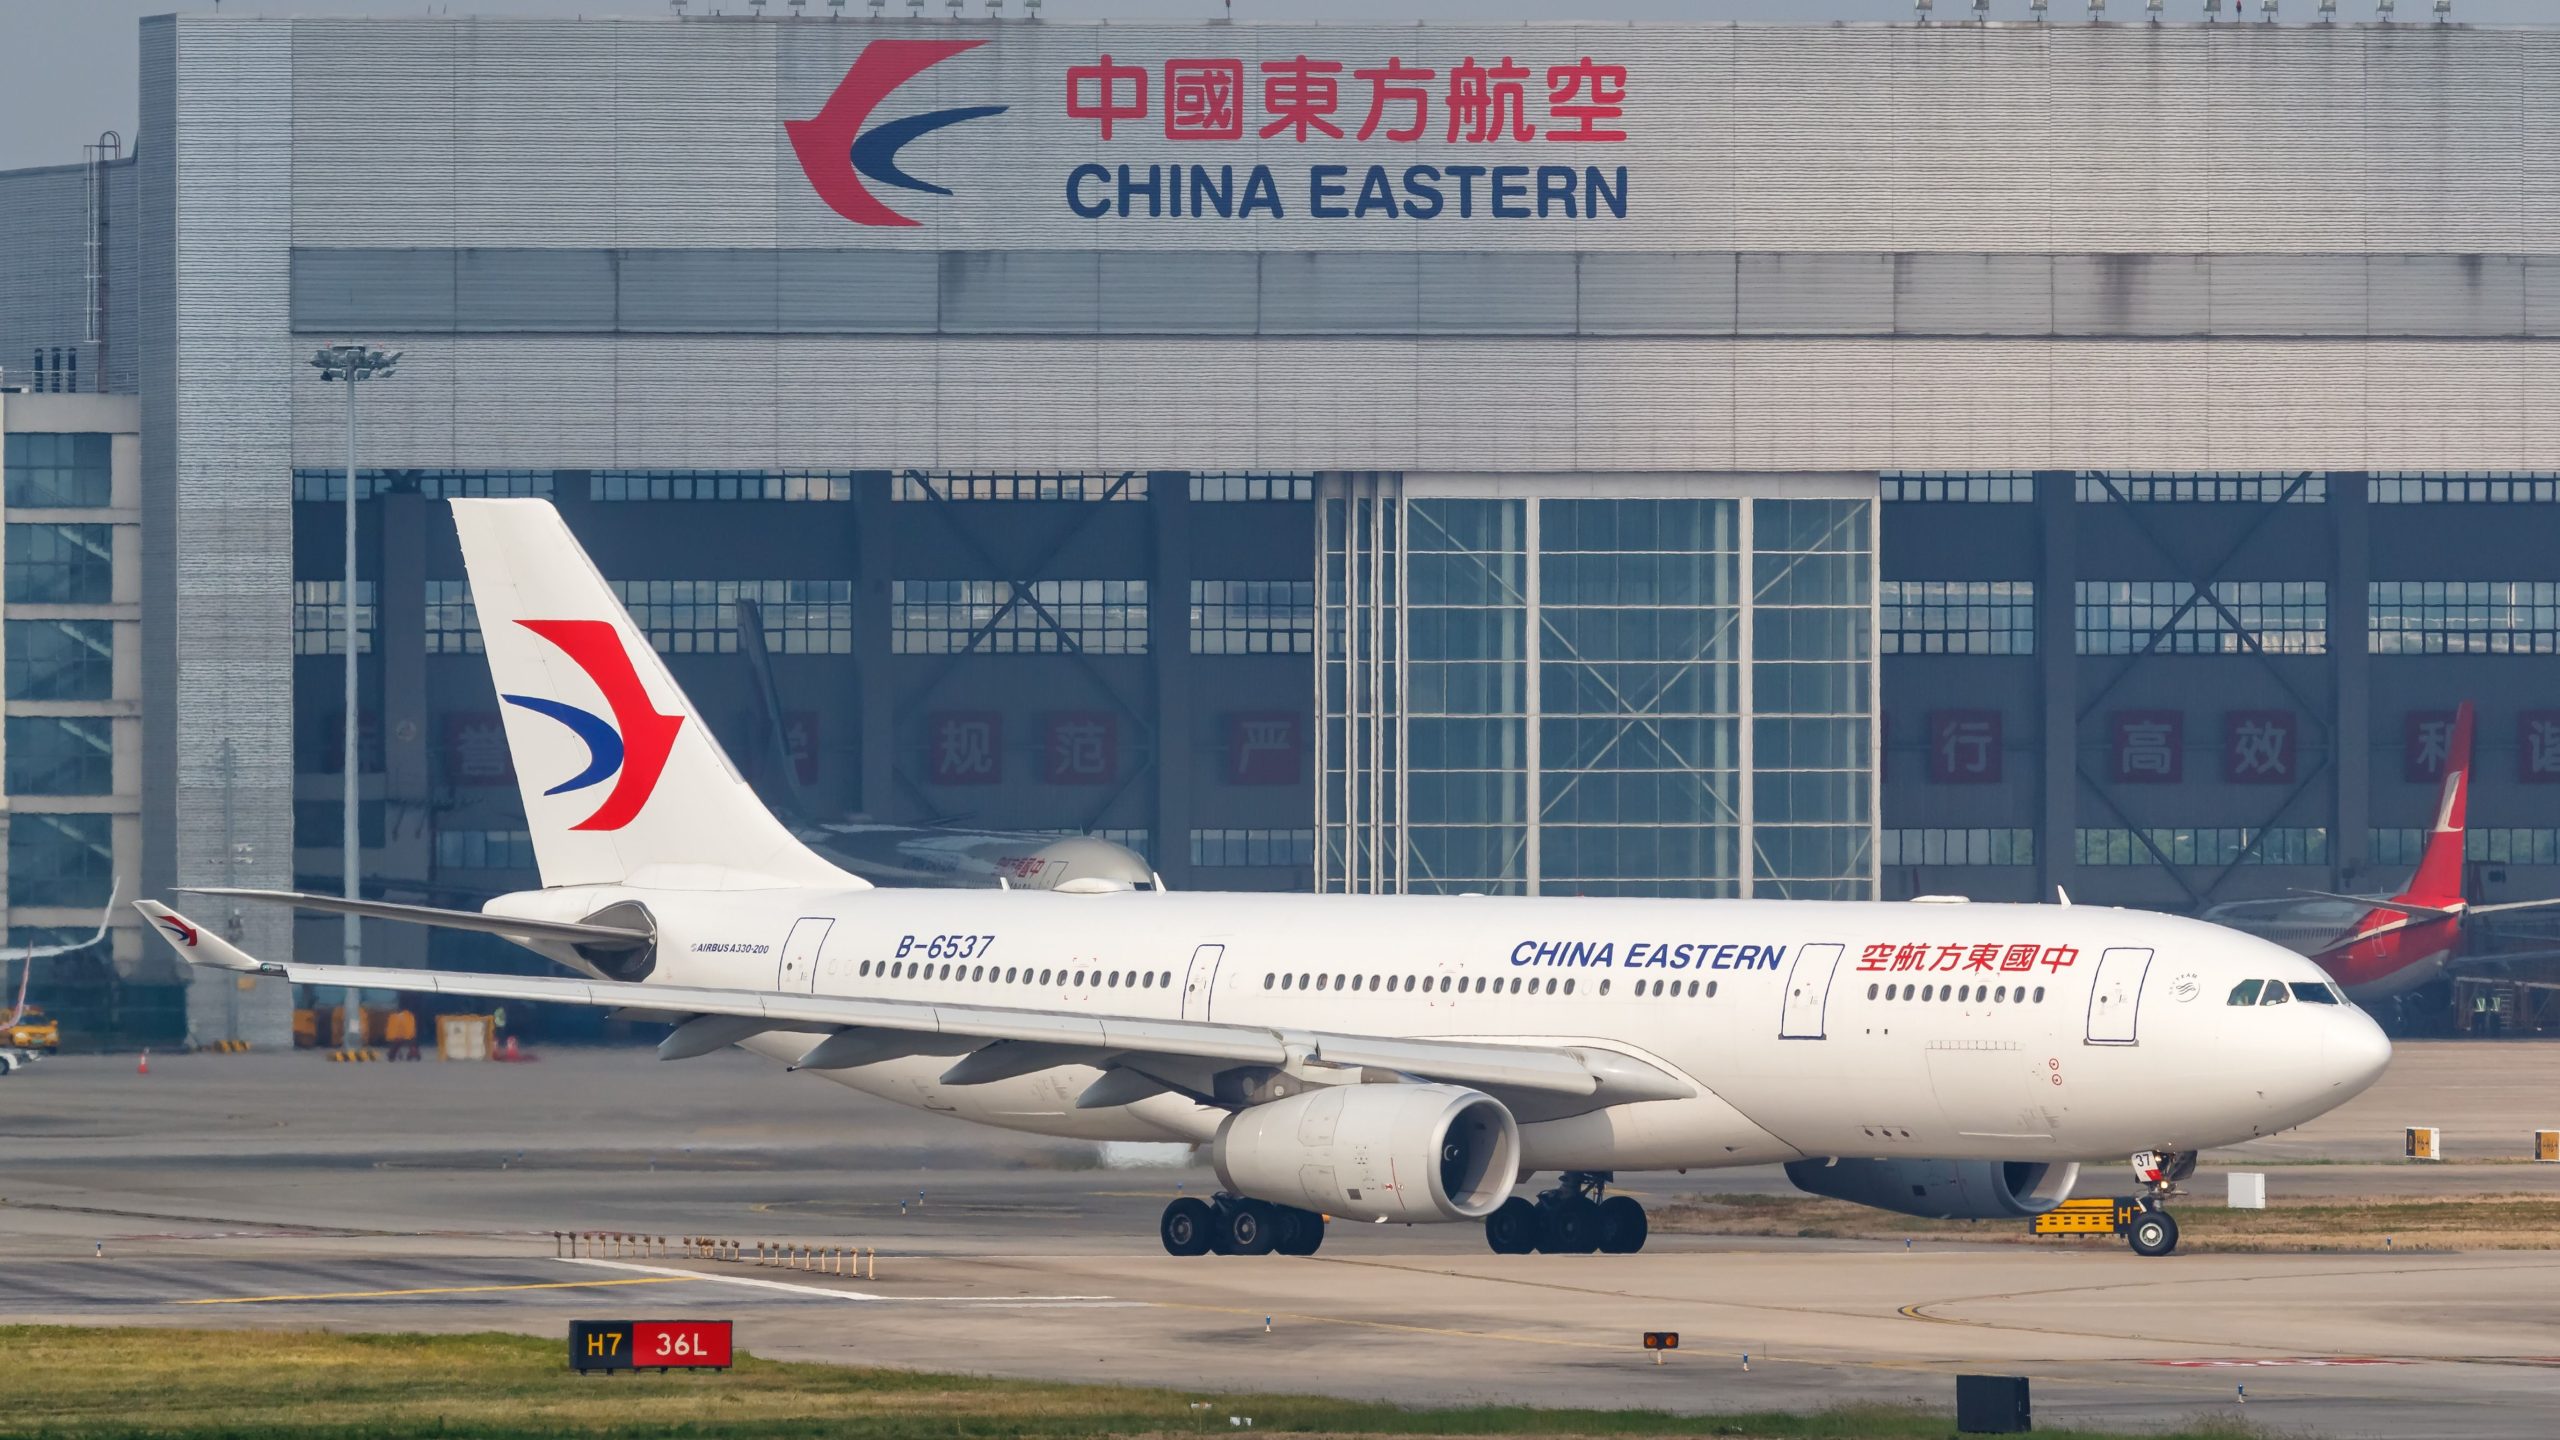
The full impact of border reopenings in China and North Asia is now clearly evident, with international traffic in Asia-Pacific increasing 98.5% YoY, although that is still 24.5% lower than in 2019. Coming off a low base, capacity increased by 85.5% and the load factor by 5.5 percentage points to a respectable 84.2%.
Photo: Vincenzo Pace | Simple Flying
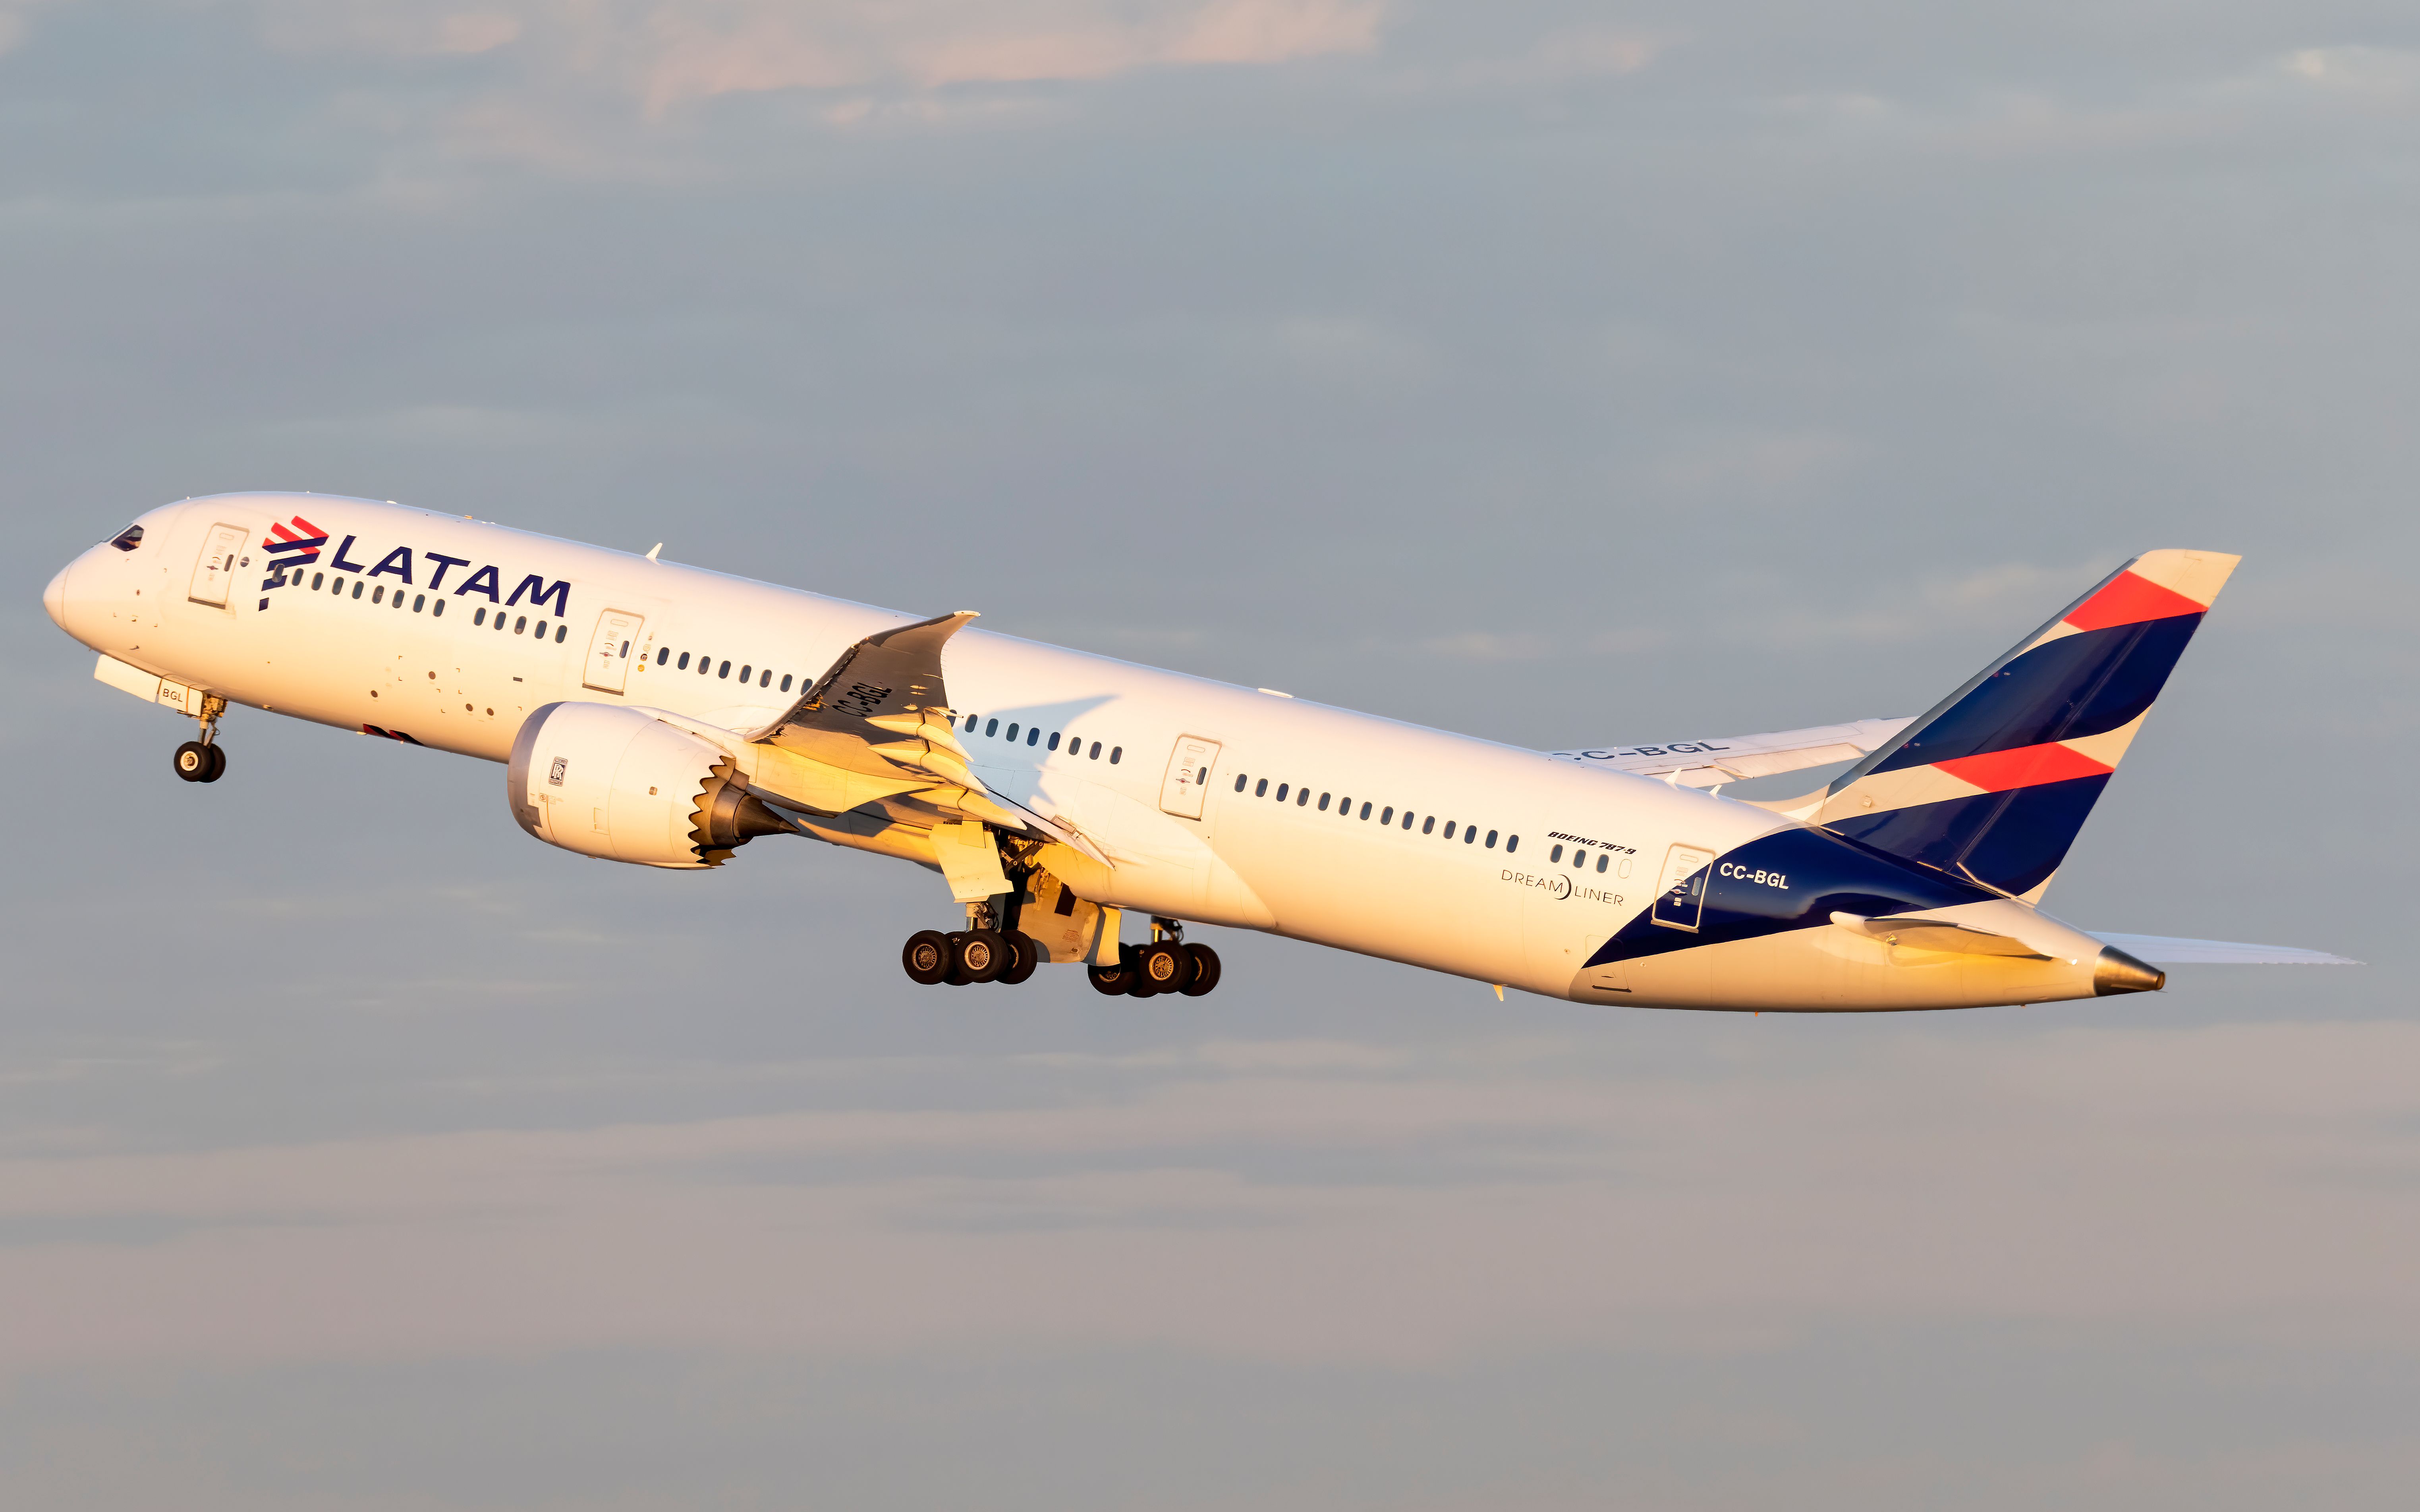
Global international traffic (RPKs) in August reached 88.5% of August 2019 levels, and the only two regions to have fully recovered international capacity to 2019 levels are North America (+0.6%) and Latin America (+0.1%). The Middle East has reached 95.7%, Europe 91.2% and Africa 88.9%.
Last month, the global international passenger load factor was 85.4%, led by North America at 87.7%, followed by Europe (86.8%), Latin America (86.1%), Asia-Pacific (84.2%), the Middle East (83.1%) and Africa (76.2%)
In August, domestic RPKs grew 25.4% YoY and were 9.2% ahead of 2019 levels, while load factors remained the same at 83.5%. IATA reports data on six major domestic markets, and of those, only two fell below pre-pandemic traffic volumes in August: Japan (-9.1%) and Australia (-2.3%).
Photo: HMBSoFL Photography | Shutterstock.
China is leading domestic recovery and last month had total RPKs that were 20.8% ahead of 2019, although it is second to the United States in terms of total RPKs. IATA said that booking data suggests China’s domestic travel has “started to cool down” but international ticket sales have sustained a positive trend and outlook for the coming months.
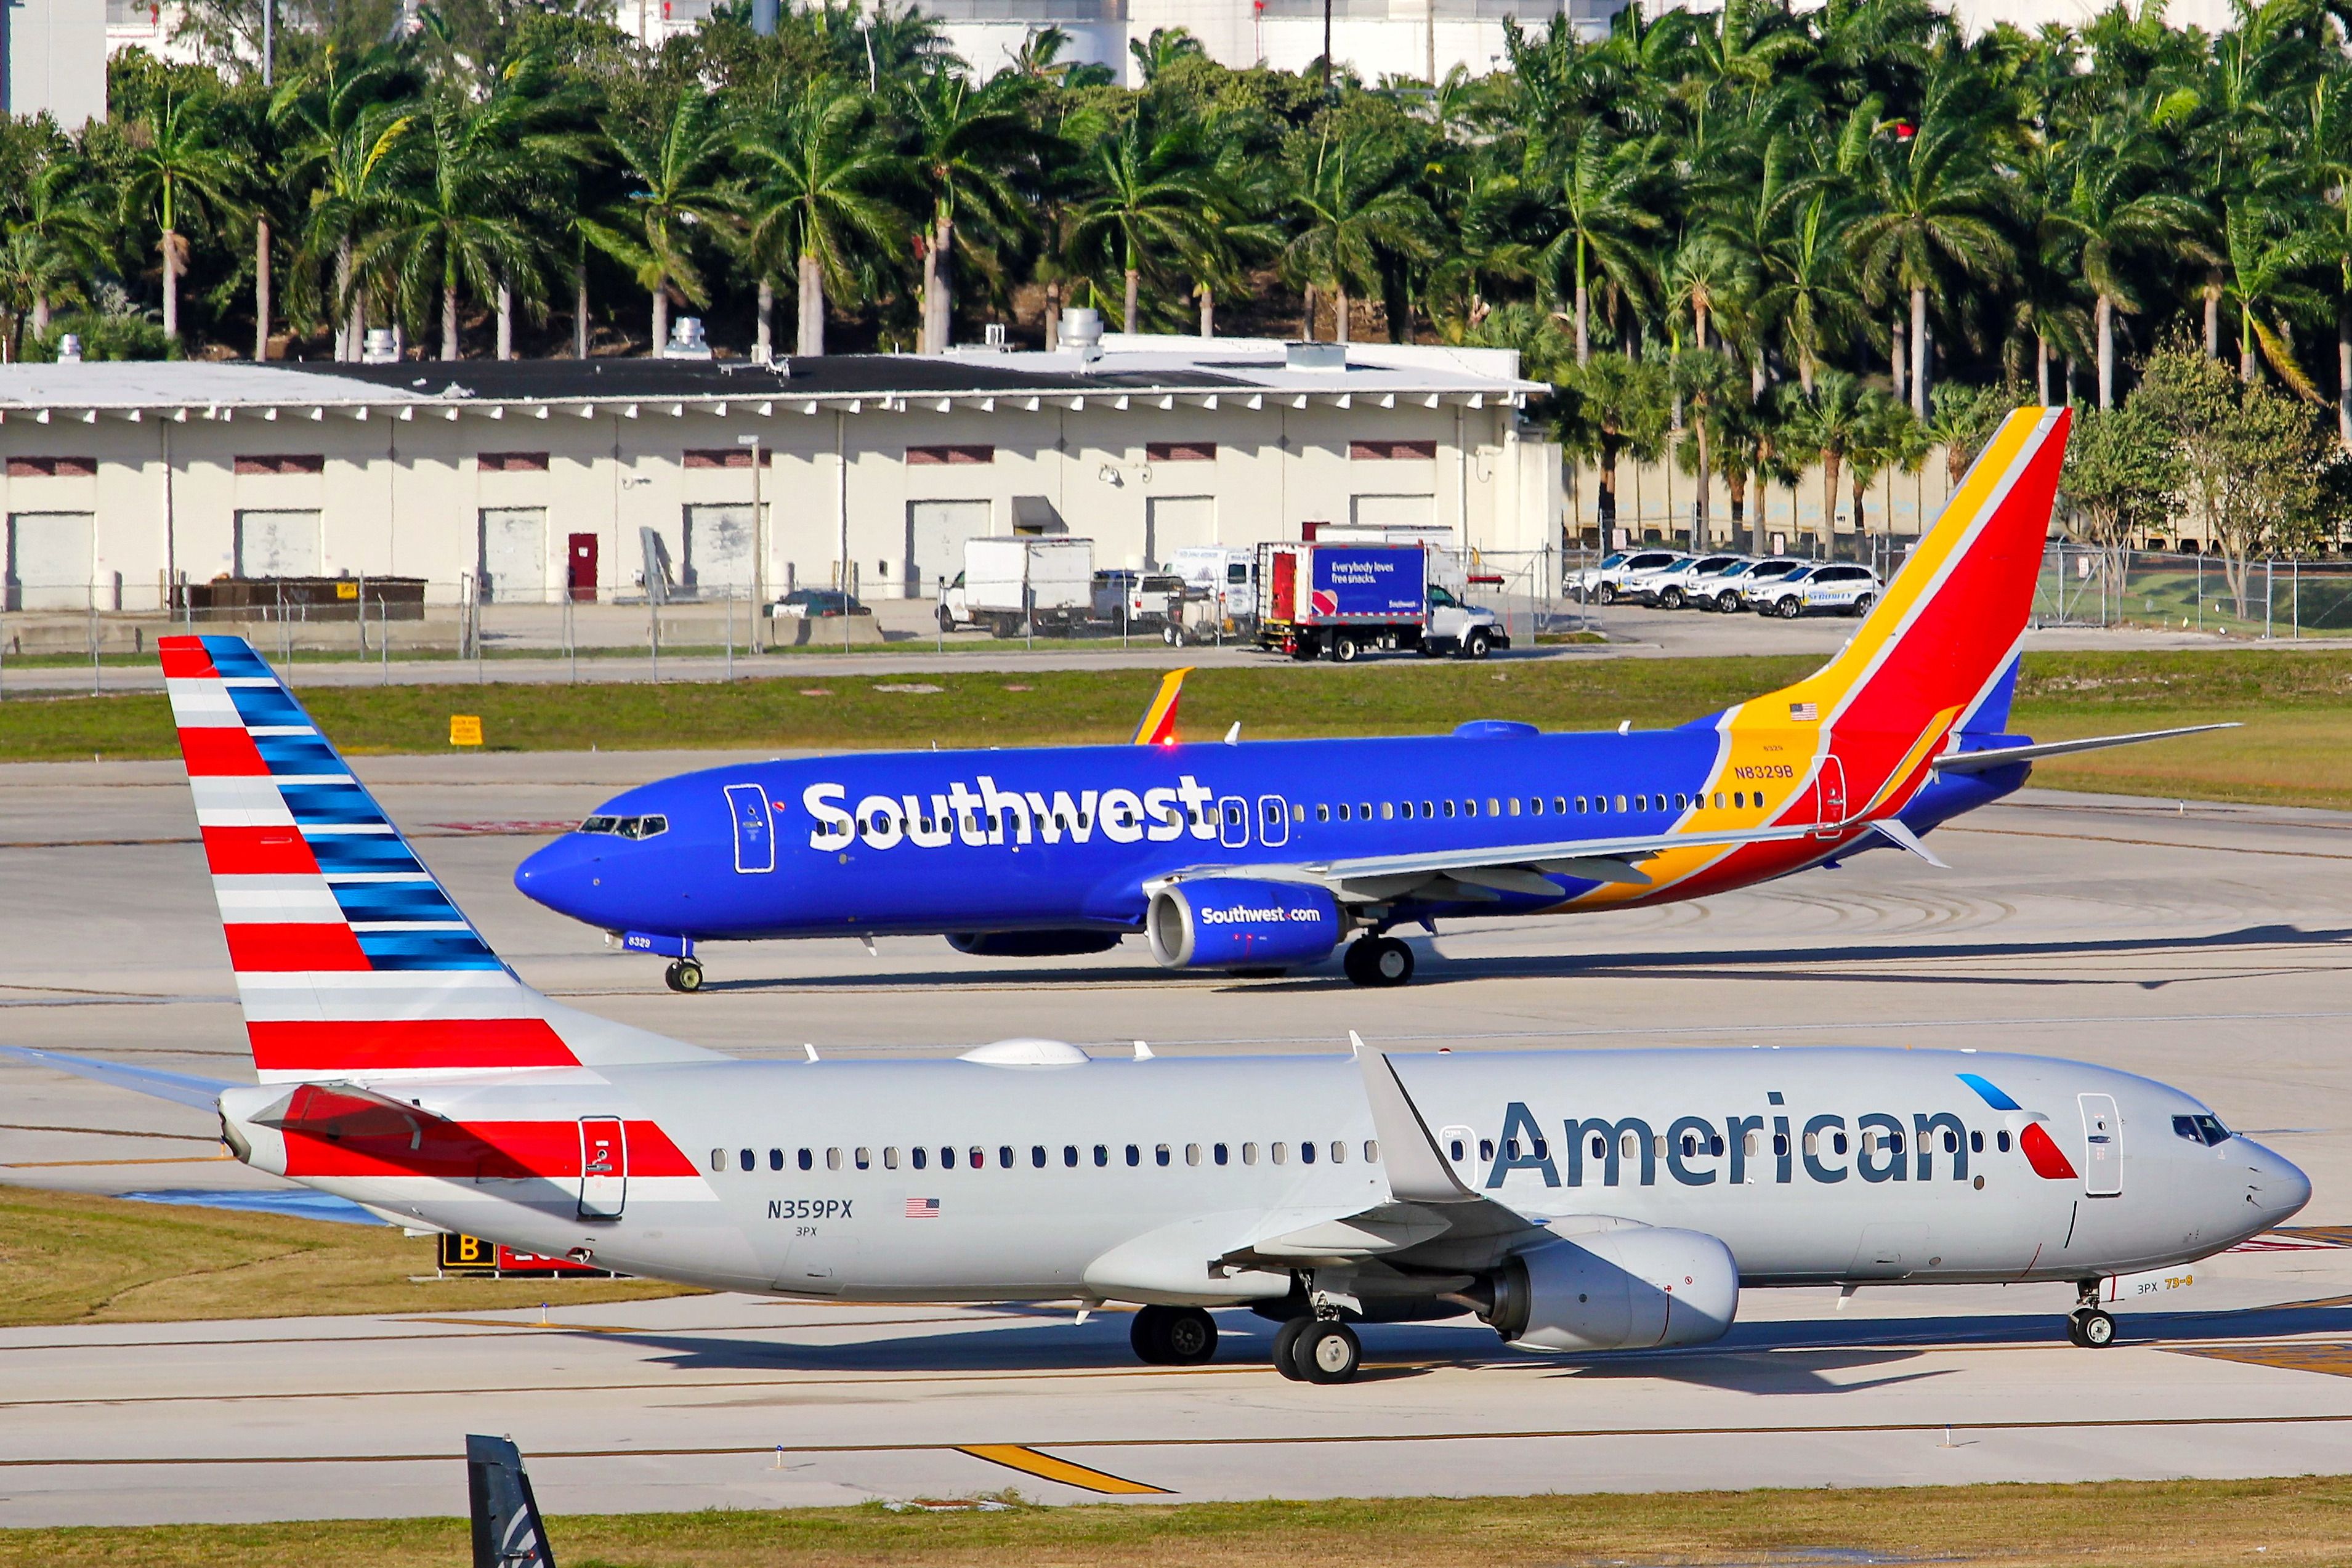
In other domestic markets, Brazil exceeded August 2019 RPKs by 8.5%, India by 6.7% and the US by 1.5%. The overall load factor was 83.5%, with the highest of 84.4% recorded in the US and the lowest of 79.1% in China.
The six domestic markets reported on by IATA account for approximately 74.6% of total domestic RPKs, and airline traffic is allocated according to the region in which the carrier is registered and should not be considered as regional traffic.


