Summary
- Airline ticket prices post-COVID are becoming more affordable as airlines recover.
- Frontier, Spirit, and Hawaiian Airlines offer the best airline affordability in the US.
- Available seat miles and passenger revenue metrics help determine airline savings.
We are all aware that the aviation world changed forever when COVID-19 restricted us to home, and passionate travelers and aviation enthusiasts watched as many of our favorite aircraft sat grounded, collecting dust, or retired altogether. However, as the world reopened for the world to see, we were first shocked to see the price of airline tickets. As airlines have recouped some of their losses and inflation starts to come under control, the cost of airline tickets is starting to subdue and being in the budget of even the most cost-conscious traveler. Let’s look at how US airlines compared between 2022 and 2023 to determine where you will get the best bang for your buck.
AirAdvisor, an airline compensation company, recently crunched the numbers and identified which airlines’ revenue seat miles increased and which decreased in the last two years. The results may surprise you.

Related
How Do Airline Ticket Prices Vary From Website To Website?
You could encounter up to a 363% difference in price across different websites
Choosing the cheapest airline in the United States depends on your criteria. There are several ‘cheap carriers,’ but it depends on where you want to travel. AirAdvisor said Denver-based Frontier Airlines was the cheapest for international travel to the Caribbean, Mexico, and Central America. However, that’s from a limited North American network.
For those looking to travel slightly further abroad, United Airlines is the best bang for your buck if you’re looking to go long-haul. With a network stretching to all inhabited continents, you could find yourself on a cheap flight to Australia, Asia, Africa, Europe, and South America with this Star Alliance carrier. It was cheaper than its biggest rivals on home soil, Delta and American Airlines.
Airline affordability
Between 2022 and 2023, their average revenue per available seat mile identified that Frontier was the leader of the pack with the best affordability rating among US carriers. This was followed closely by Spirit and Hawaiian Airlines. Check out the top ten below:
|
Placing |
Airline |
Headquarters |
Revenue per seat mile |
|---|---|---|---|
|
1st |
Frontier Airlines |
Denver |
$0.0985 |
|
2nd |
Spirit Airlines |
Miami |
$0.1110 |
|
3rd |
Hawaiian Airlines |
Honolulu |
$0.1236 |
|
4th |
Allegiant Air |
Las Vegas |
$0.1294 |
|
5th |
JetBlue Airways |
New York |
$0.1324 |
|
6th |
Alaska Air |
Seattle |
$0.1554 |
|
7th |
United Airlines |
Chicago |
$0.1650 |
|
8th |
American Airlines |
Dallas |
$0.1730 |
|
9th |
Southwest Airlines |
Dallas |
$0.1732 |
|
10th |
Delta Air Lines |
Atlanta |
$0.1761 |
What does this mean for travelers?
The calculation of an airline’s available seat miles measures the aircraft’s carrying capacity and availability to generate revenue. The revenue passenger mile is an industry metric identifying the miles traveled by paying passengers. There are two key acronyms to follow:
Available seat miles (ASM)
This standard measurement of the airline’s output shows the aircraft seat per mile, occupied or not. An aircraft that can seat 200 passengers and fly 200 miles can generate 20,000 available seat miles.
Passenger revenue per available seat mile (PRASM)
This is often referred to as unit revenue and is calculated by dividing the number of passengers’ revenue by the available seat miles. This measure is presented in cents per mile and is equivalent to the product of load factor or passenger yield.
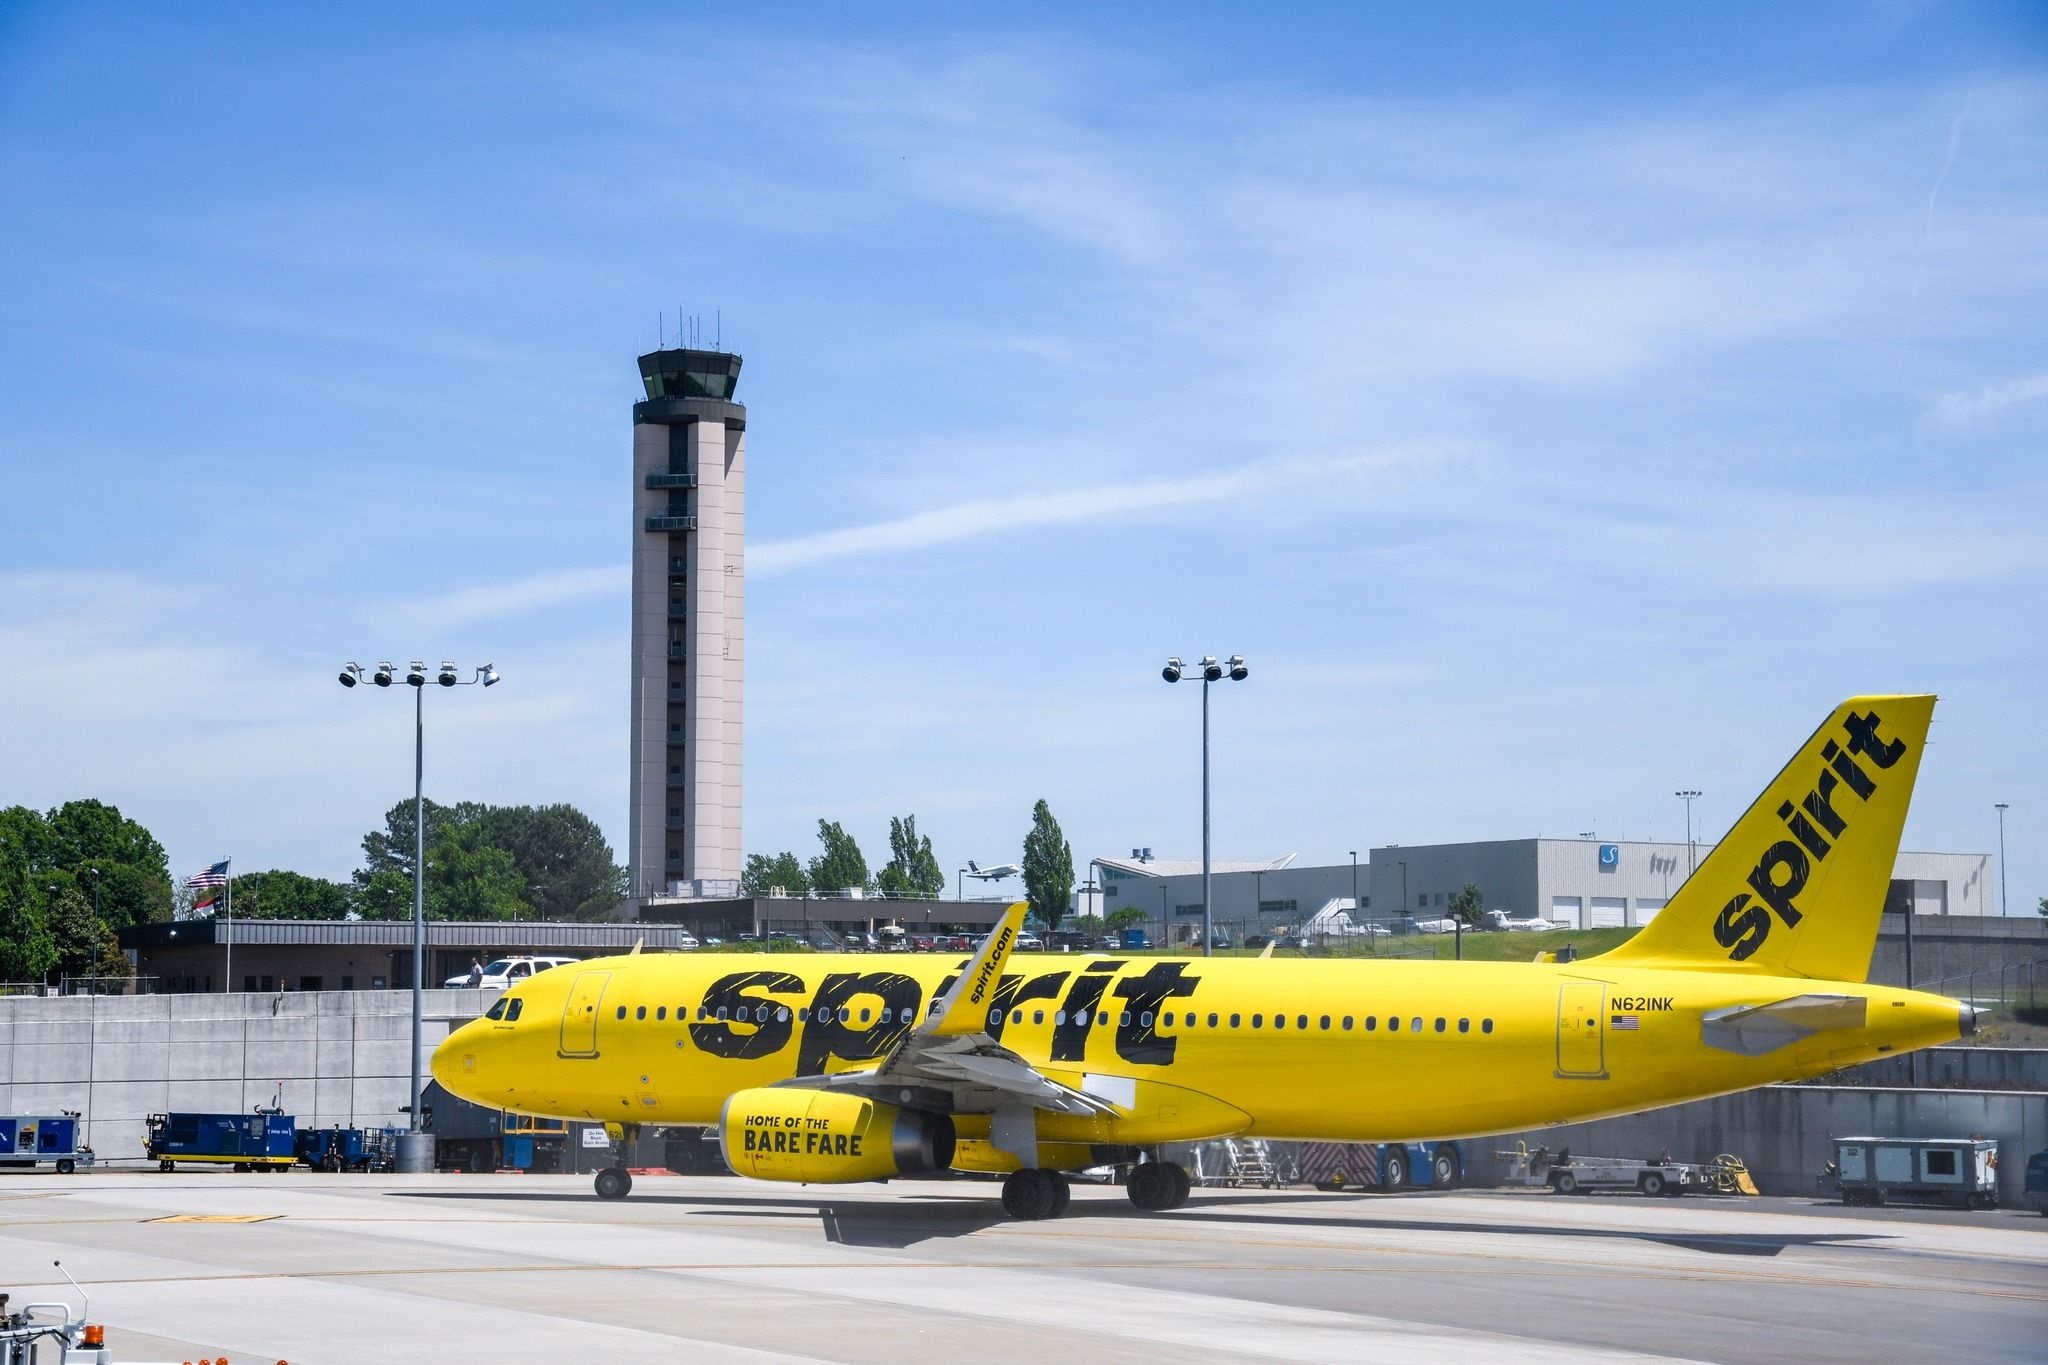
Photo: Raleigh–Durham International Airport
Comparison between 2022 and 2023
Data from AirAdvisor identified that airlines in the top ten have had differing results in revenue over the last two years, with passenger revenue per available seat miles fluctuating, with some improving while others declined. Check out the figures below:
Passenger Revenue per Available Seat Mile
|
Airline |
IATA code |
2022 |
2023 |
Difference |
Result |
|---|---|---|---|---|---|
|
Frontier Airlines |
F9 |
$0.1048 |
$0.0949 |
-$0.0099 |
Cheaper! |
|
Spirit Airlines |
NK |
$0.1167 |
$0.1052 |
-$0.0115 |
Cheaper! |
|
Hawaiian Airlines |
HA |
$0.1253 |
$0.1218 |
-$0.0035 |
Cheaper! |
|
Allegiant Air |
G4 |
$0.1250 |
$0.1338 |
+$0.0088 |
More expensive |
|
JetBlue Airways |
B6 |
$0.1324 |
$0.1315 |
-$0.0009 |
Cheaper! |
|
Alaska Airlines |
AS |
$0.1554 |
$0.1521 |
-$0.0033 |
Cheaper! |
|
United Airlines |
UA |
$0.1615 |
$0.1684 |
+$0.0069 |
More expensive |
|
American Airlines |
AA |
$0.1713 |
$0.1747 |
+$0.0034 |
More expensive |
|
Southwest Airlines |
WN |
$0.1729 |
$0.1735 |
+$0.0006 |
More expensive |
|
Delta Air Lines |
DL |
$0.1724 |
$0.1798 |
+$0.0074 |
More expensive |
The table shows that while results are mixed, many airlines have decreased their revenue per ASM; however, a number has increased, such as Allegiant, United, American, Southwest, and Delta Air Lines. The highest increase was witnessed by Washington-based Allegiant, causing the carrier to drop to the fourth most cost-efficient carrier.
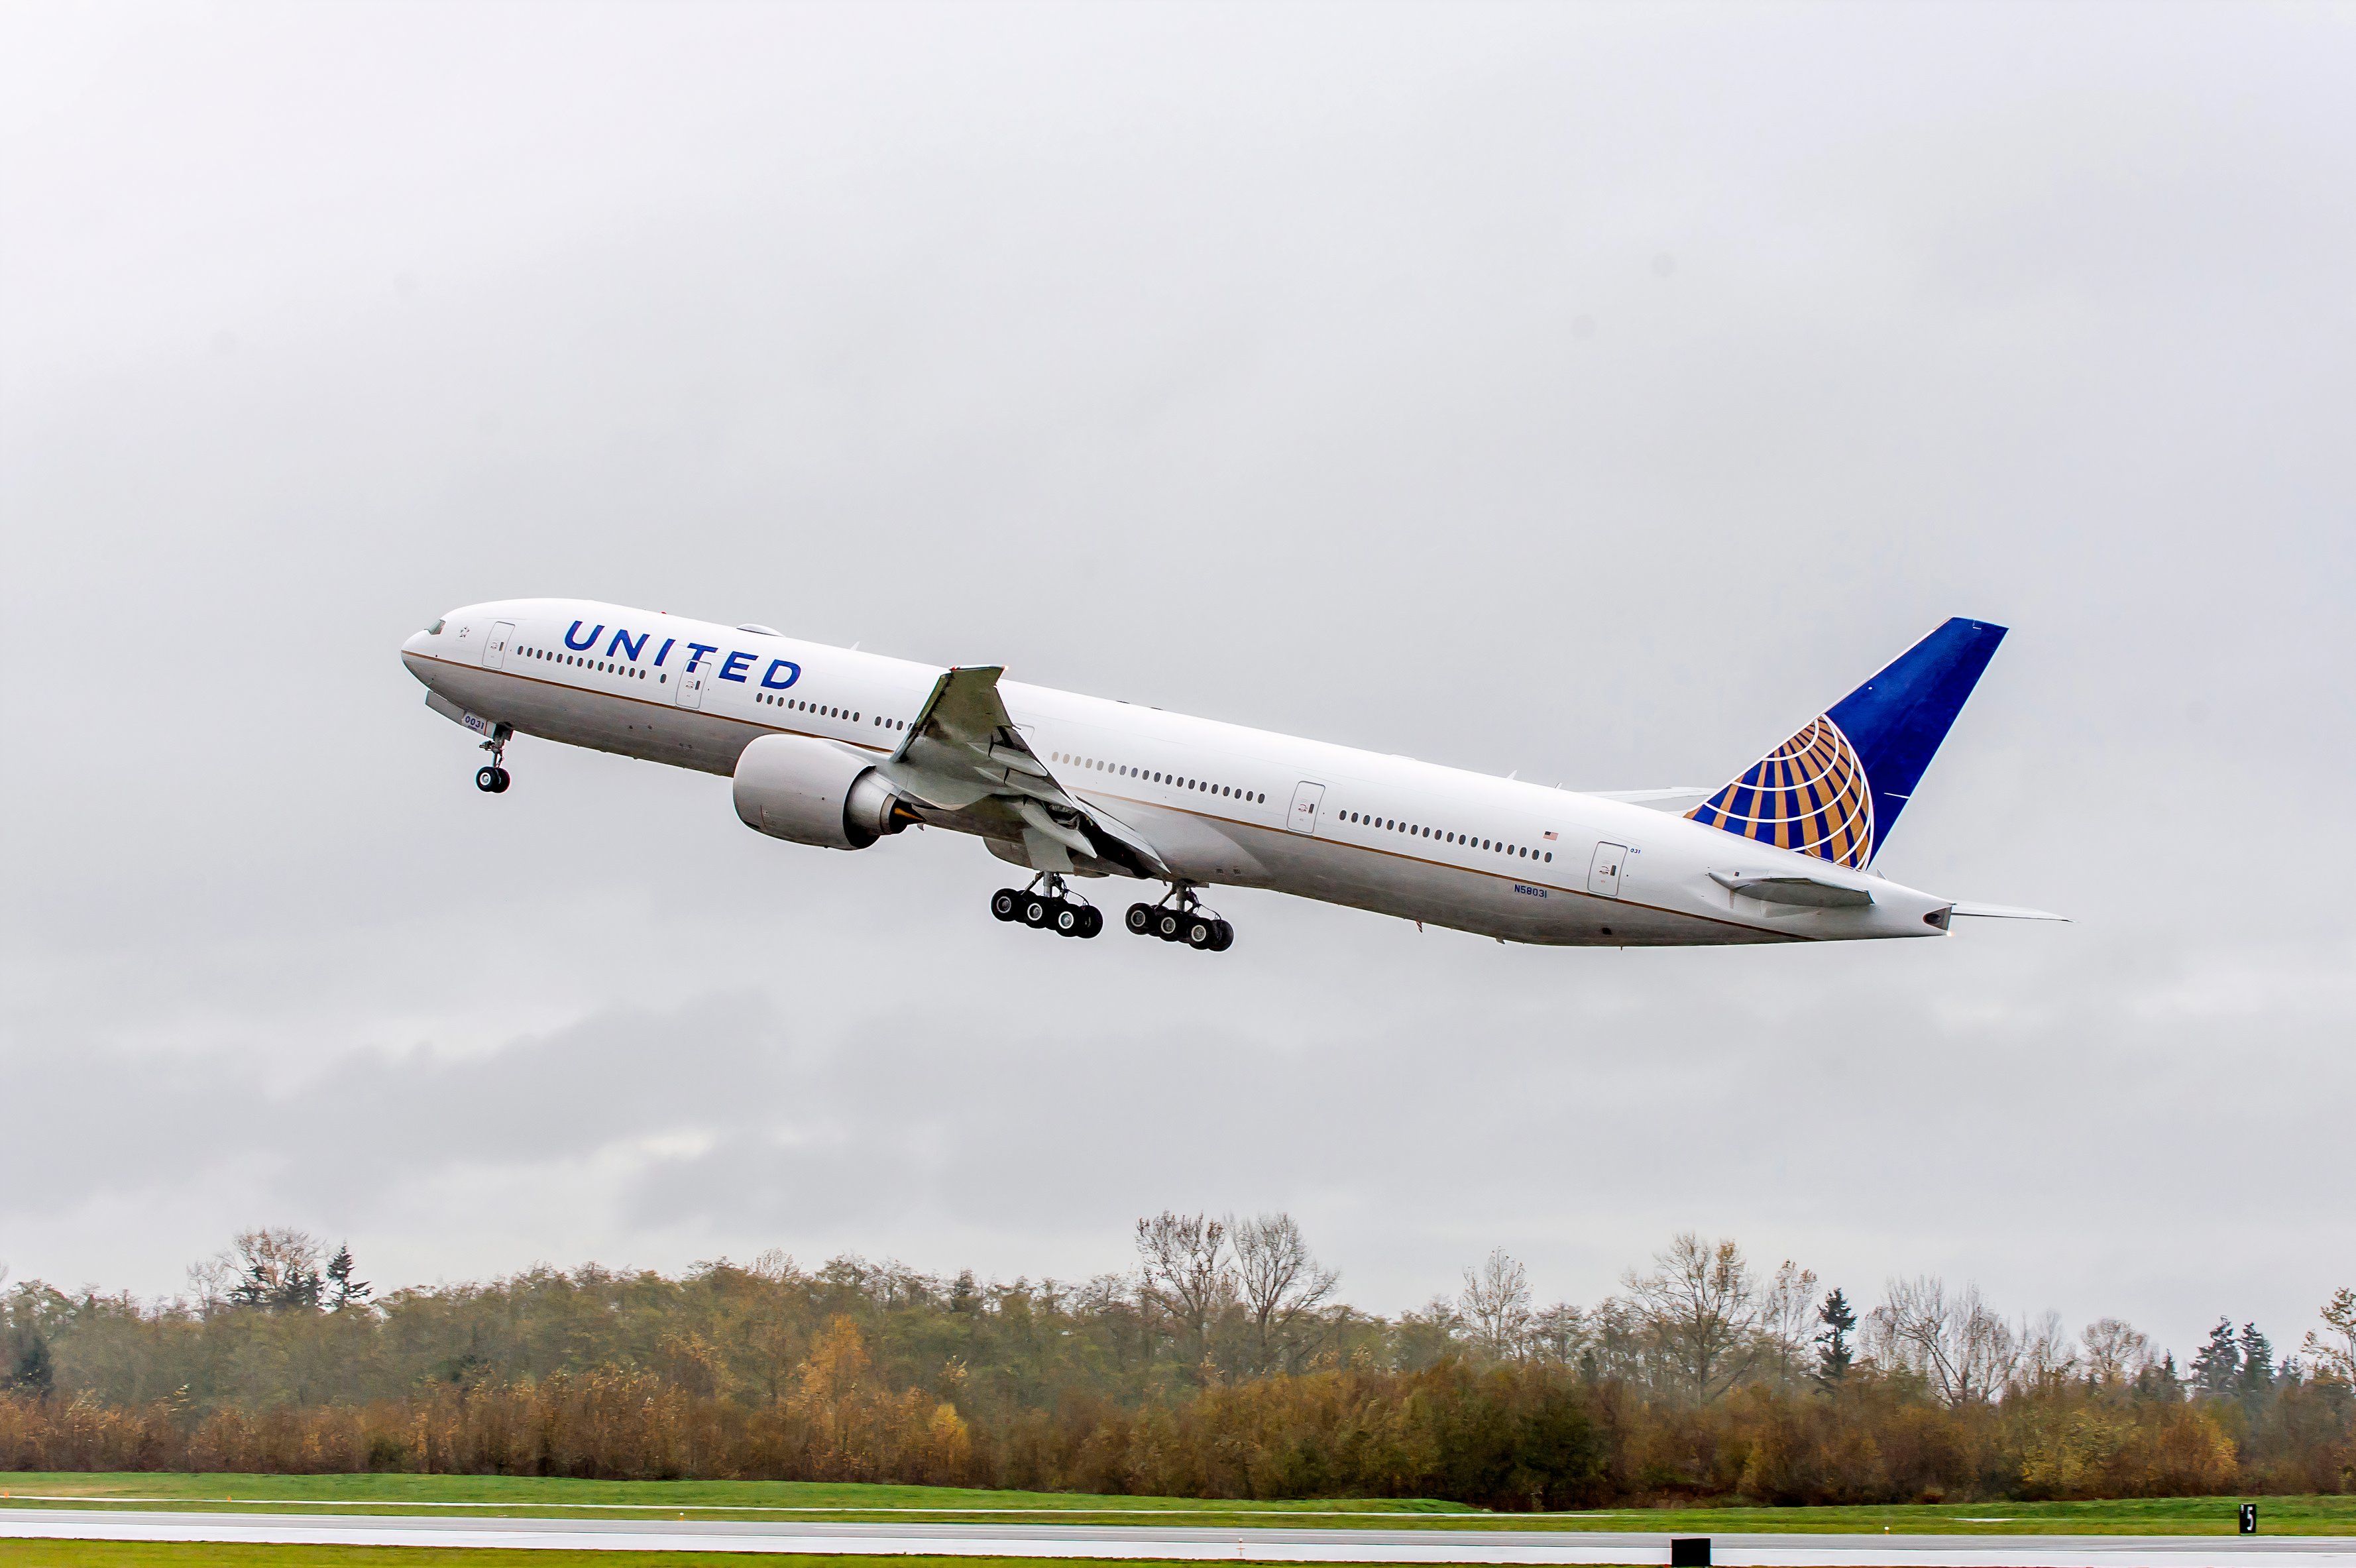
Photo: United Airlines
What does all this mean?
While all these numbers may be confusing, and you want to know where to get the best bargain for your next overseas trip, it depends on when and where you want to travel. Airlines frequently have specials for upcoming holidays or summer breaks. It’s always prudent to plan your trips far in advance and make the most of airline specials as they come up. For example, if you’re interested in escaping the North American winter and keen to kick back and relax on the beaches of Mexico while it’s snowing at home after Christmas, start looking now, and you might find yourself a bargain. Leaving booking a ticket to the last minute means typically limited seats and availability; in return, you pay more.

Related
Analysis: 5 Key Factors That Influence Airline Ticket Prices
Air travelers must make smart decisions to avoid hiked ticket prices.
How far in advance do you book your travel? Let us know in the comments.


