Summary
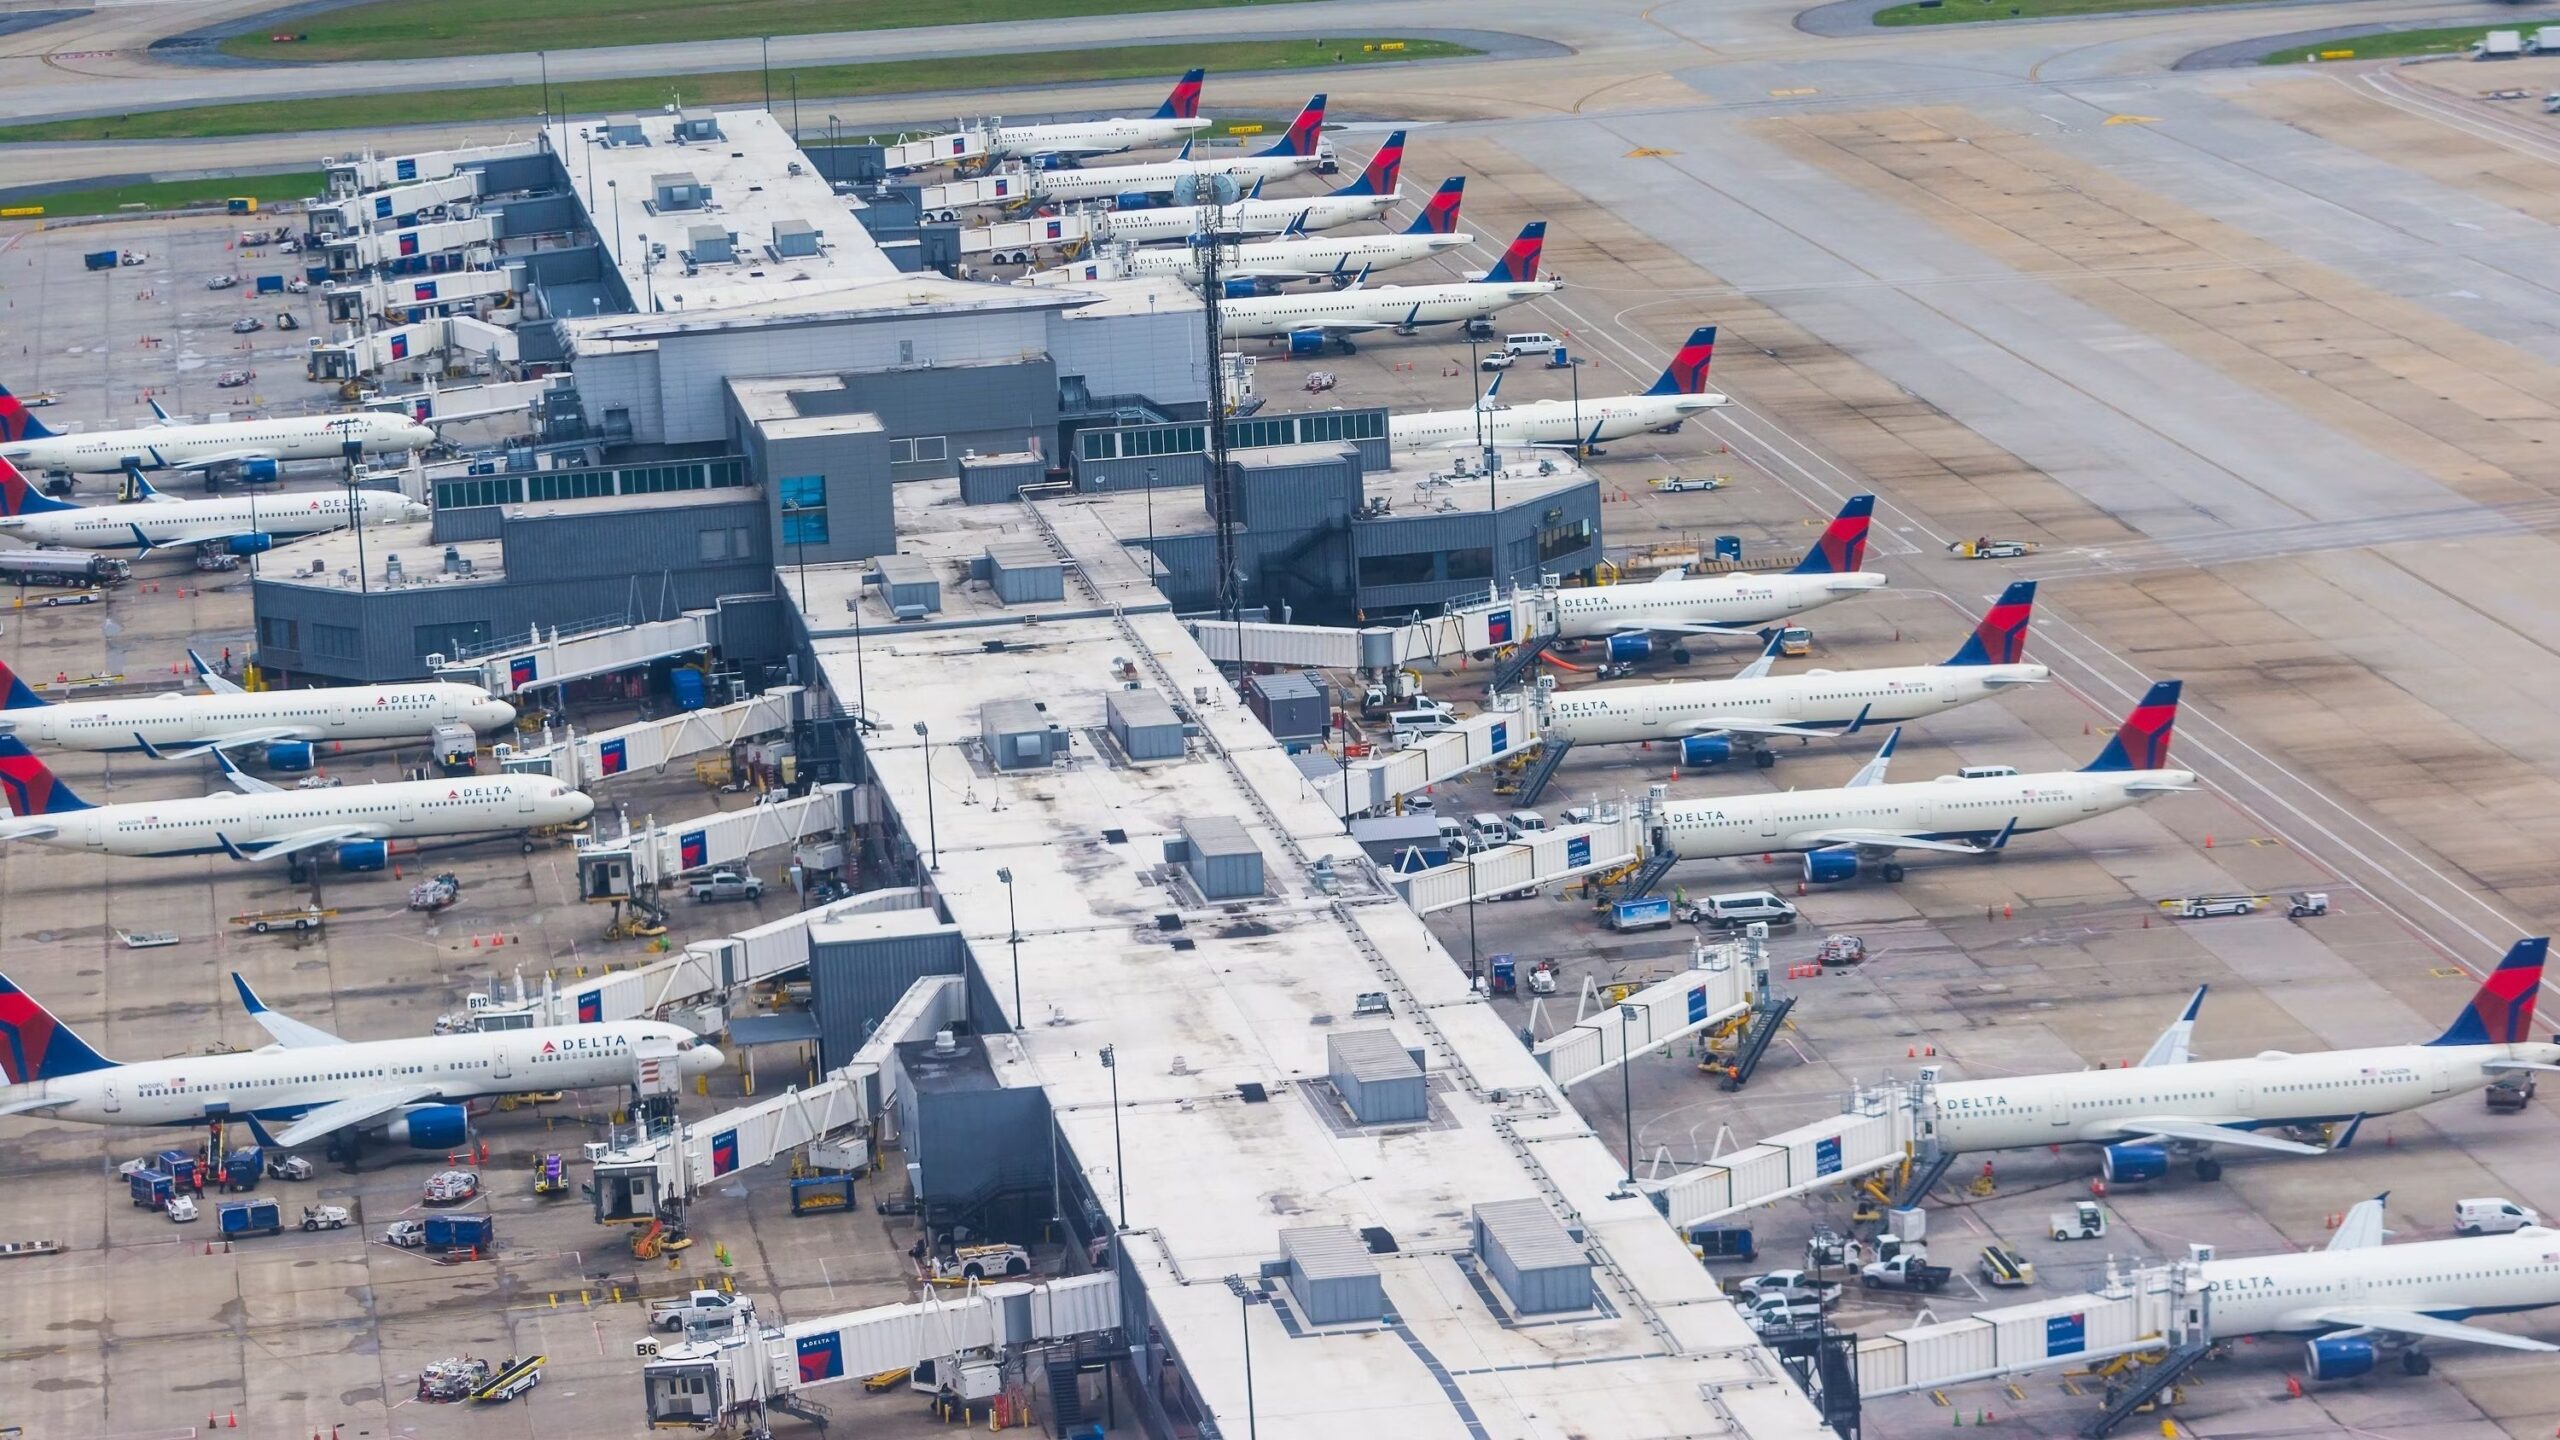
- Atlanta Hartsfield-Jackson Airport leads in passenger traffic with 104.7 million, way ahead of its rivals globally.
- Guangzhou Baiyun International soared back to the 12th spot in 2023, showing a significant recovery in passenger numbers.
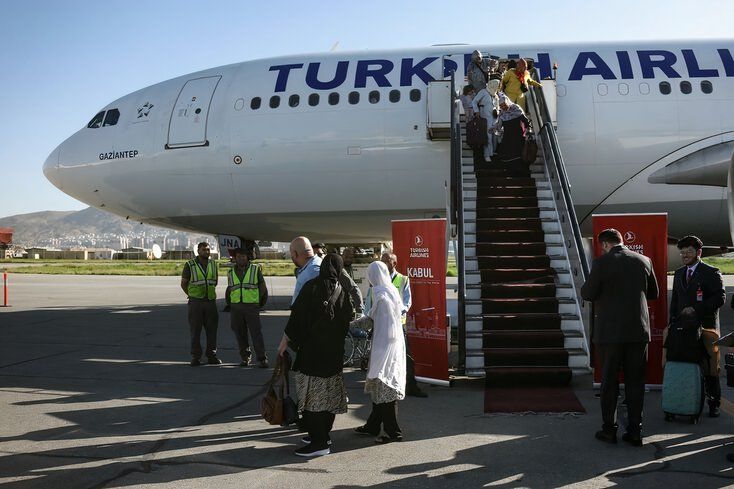
- Istanbul Airport stands out, with passengers up by 46% compared to 2019 and aircraft movements up by 53%.
Today, Airports Council International (ACI) World confirmed that they got it right with their preliminary figures issued in February, a remarkable 99.9% accuracy between the preliminary and confirmed figures released five months later. The final 2023 figures show passenger numbers increased by 30.5% year-on-year and recovered 94.2% compared to pre-pandemic 2019.
ATL is in a league of its own
Before the pandemic struck, there was plenty of chatter around the center of global aviation shifting eastwards from the United States, first touching the Middle East transit hubs and then landing in Asia, driven by the seemingly endless demand for air travel in China. While that may happen someday, the US is not giving up the crown easily, with Atlanta Hartsfield-Jackson (ATL) handling 104.7 million passengers in 2023, nearly 18 million more than its closest rival, Dubai International (DXB).
Photo: Markus Mainka I Shutterstock
In 2023, global passenger traffic was close to 8.7 billion, with the top 20 airports accounting for 1.41 billion, or 16% of global traffic. That was a 26.4% YoY gain and a 96.8% recovery from the 1.46 billion handled by the top 20 airports in 2019. ACI World Director General and CEO Luis Felipe de Olivera said the dataset findings indicate that the demand for air travel is as strong as ever.
“China’s reopening fuelled much of 2023’s strong growth and has propelled Guangzhou Baiyun International back into the Top 20. Hartsfield-Jackson continues to lead the way, but the revival of Middle Eastern and Asian hubs is the standout takeaway from 2023 figures.”
Illustrating his point is the performance of Guangzhou Baiyun International (CAN), which reached the top of the rankings in 2020, fell to 58th in 2022, but soared back to the 12th spot in 2023, handling 63.2 million passengers. The biggest jump in the 2023 rankings came from Seoul Incheon (ICN), which handled 56.2 million passengers, taking it from 99th in 2022 to 20th in 2023.

Related
Melbourne Airport And Asiana To Strengthen Airbus A350 Seoul Sisters Route
The airport has secured a second seasonal service that will start in July and run to September.
Eight of the top 20 airports are located in the United States, and in order, they are ATL, Dallas-Fort Worth (DFW), Denver International (DEN), Los Angeles International (LAX), Chicago O’Hare (ORD), New York (JFK), Orlando International (MCO) and Las Vegas Harry Reid (LAS).
Istanbul is climbing the charts
The most recovered compared to 2019 is Istanbul (IST) at +46%, followed by Orlando (14%), Denver (13%), Las Vegas (12%), Dallas-Fort Worth (9%) and New Delhi (5%). Those with the most ground to make up are led by Seoul Incheon at 21% fewer than in 2019, followed by Frankfurt (-16%), Los Angeles LAX (-15%), Guangzhou (-14%) and Singapore Changi (-14%).
Photo: Simple Flying
In 2023, the ACI reported nearly 96 million global aircraft movements, up by 12.6% YoY but 92.8% of what was done in 2019. This is an interesting figure, given that passenger numbers are much closer to 2019 levels than overall aircraft movements, which may suggest that more larger-capacity aircraft are operating.

Related
276 Destinations: Turkish Airlines’ World Leading Hub Network At Istanbul Airport
Five airports have joined its network this year.
Of the Top 20 airports for aircraft movements, there are only five that have exceeded 2019 levels. The standout on this metric is Istanbul Airport IST, which had 53% more movements in 2023 compared to 2019, followed by Miami MIA (11%), Las Vegas LAS (11%), New York JFK (6%), Denver DEN (4%) and Phoenix PHX (4%). Chicago ORD is 22% behind 2019 movements, followed by Los Angeles LAX (-17%), Frankfurt (-16%), Shanghai PVG (-15%), Atlanta ATL (-14%), Amsterdam AMS (-10%) and Paris CDG (-10%).
ACI World collects passenger numbers from its global network of airport operator members, investors and aviation stakeholders. That data unwraps passenger, cargo and aircraft movement rankings for more than 2,700 airports in 185 countries and territories.


