Aviation Statistics 2024 By Market Size, Valuation, Pilot Demographics, Best Airports, Leading Airlines by Brand Value, Best Airlines and Best Airports
August 28, 2024
—
Introduction
Aviation Statistics: Aviation is the art and science of flying, encompassing not only airplanes but also helicopters. The industry is categorized into commercial, general, and military sectors, each playing a crucial role in providing transportation services and ensuring national security.
These Aviation Statistics highlight the industry’s significance in supporting the global economy through functions such as transportation, military operations, space exploration, and international connectivity. Advancements in technology are continuously shaping the aviation sector, positioning it for substantial growth in the future.
Editor’s Choice
- As of 2023, the aviation industry in the USA was predominantly male, with 88.8% of aerospace engineers being male and 11.2% female.
- In 2022, the average daily passengers for airlines in the USA were 2,512,411, with a yearly total of 917,029,842 passengers.
- Presently, there are over 5,000 aerospace engineers employed in the sector.
- Flight delays in the NAS System are recorded for flights arriving 15 minutes late at their destination.
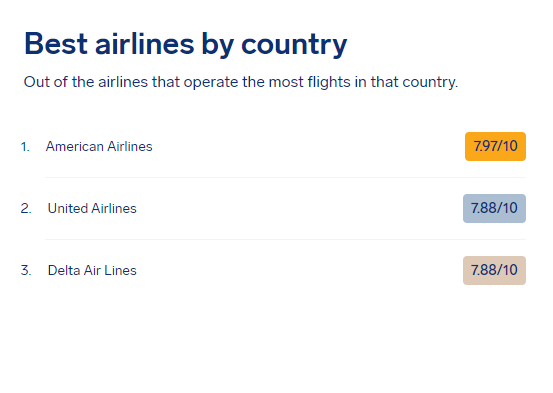
- In 2023, American Airlines was rated the top airline with a score of 7.97/10, followed by United Airlines and Delta Air Lines (both at 7.88/10).
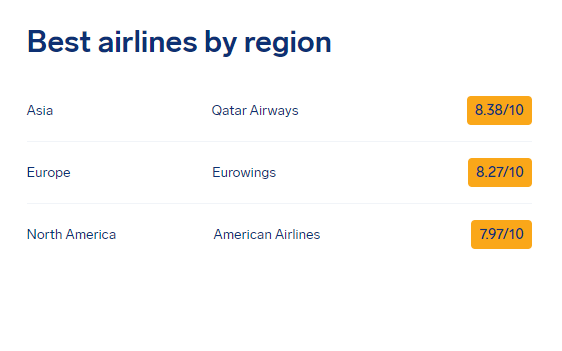
- The best airlines by region in 2023 were Qatar Airways, Asia (8.38/10), Eurowings, Europe (8.27/10), and American Airlines, North America (7.97/10).
- In FY 2022, center holding operations were recorded at 24,813, indicating deliberate delays due to flying in repeating patterns.
- The total number of core 30 airport operations in 2022 was 11,758,471, showing a 23.2% increase from 2021.
- Aviation Statistics from the FAA Air Traffic Organization indicate that in 2022, airports like Atlanta, Memphis, Chicago, Dallas-Fort Worth, and Denver had the highest average daily capacity, resulting in over 3,000 operations daily.
- In the NAS (National Aerospace System) of 2022, over 5,300 flights per minute were en route during peak hours from 1500 GMT to 2200 GMT.
You May Also Like To Read
- Airlines Statistics
- Most Expensive Airlines
- Ridesharing Industry Statistics
- Electric Vehicle Statistics
- LYFT Statistics
- Tesla Statistics
- Trucking Industry Statistics
- Car Rental Statistics
- Food Truck Statistics
General Aviation Statistics
- In the USA, the average daily passengers for airlines in 2022 were 2,512,411, with a yearly total of 917,029,842 passengers.
- Aviation Statistics for 2022 indicated an average hourly capacity of 3,676 across all main/core 30 airports in the USA.
- In the NAS (National Aerospace System) of 2022, peak hours from 1500 GMT to 2200 GMT saw 5,300 flights every minute in transit.
- Approximately 41.4 million operations were recorded in center operations for FY2022.
- The total number of core 30 airport operations in 2022 was 11,758,471, marking a 23.2% increase from 2021.
- Furthermore, FAA Air Traffic Organization’s Aviation Statistics for 2022 highlighted airports like Atlanta, Memphis, Chicago, Dallas-Fort Worth, and Denver with the highest daily capacity, exceeding 3,000 operations daily.
- 175 airspace flow programs were introduced by air traffic managers in 2022.
- Center holding operations in FY2022 totaled 24,813, leading to deliberate aircraft delays due to repetitive flight patterns.
- According to Aviation Statistics from the FAA Air Traffic organization, in FY2022, there were 299 runway occurrences at Core 30 Airports, involving misplacement issues impacting aircraft movements.
- Today, the industry employs over 5,000 aerospace engineers, with manufacturing jobs considered top-paying positions for them.
- The global Airline Industry is projected to generate total profits of $25.7 billion.
- In 2023, Chinese air traffic surged by 90% compared to pre-pandemic levels.
- Revenue passenger kilometers (RPKs) increased by 46% in April 2023, with the industry-wide passenger load factor hitting 81% with a YoY growth of 40%.
- By 2036, the industry is expected to create 15.5 million direct aviation jobs, contributing $1.5 trillion to the GDP and global economy.
- Over 200,000 flights are estimated to operate worldwide by 2030.
- In August 2023, US airlines served 83.1 million passengers, including both domestic and international travelers, based on data from the Bureau of Transportation Statistics (BTS).
- By 2024, it is anticipated that 57% of airports globally will implement self-boarding gates utilizing biometrics and ID verification.
- The commercial aircraft engine market is projected to reach a value of $79.9 billion by 2027.
- By 2050, the aviation industry will need approximately 450 billion liters of sustainable aviation fuel production to achieve the Net Zero Target.
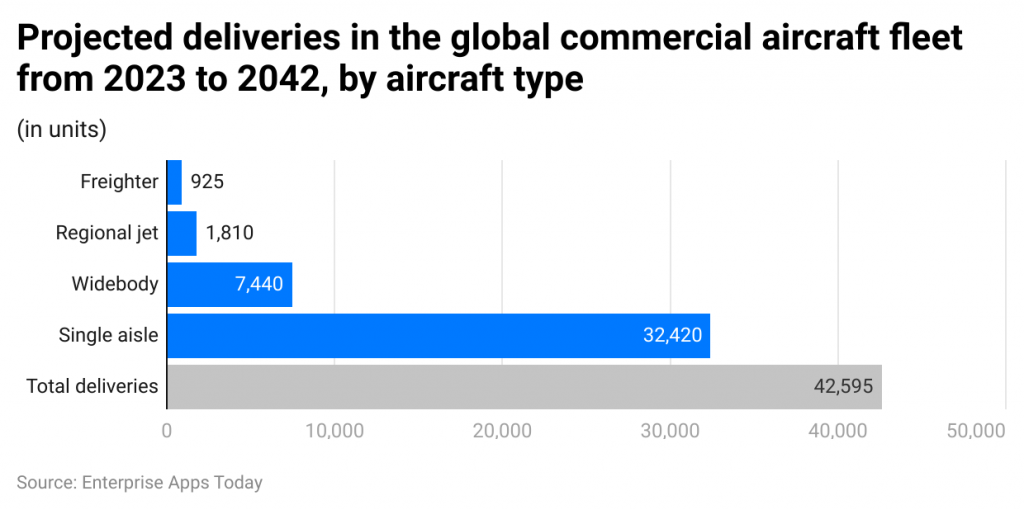
- Over 42,595 new aircraft are expected to be delivered globally by 2042.
Mishandled Reports in the USA
- In 2023, Southwest Airlines had the highest number of enplanements at 11,400,425, of which 44,783 were mishandled, resulting in a mishandled bag rate of 0.39% per 100 enplanements.
- Additionally, 20,074 wheelchairs and scooters were enplaned, of which 291 were reported as mishandled.
By Market Size/Valuation
- Flight figures for the worldwide airline industry were anticipated to reach 34.4 million, according to Aviation Statistics.
- By 2038, the global market for aircraft maintenance and engineering services is expected to value at $2.4 billion.
- Revenue within this segment is forecasted to hit $83.5 billion.
- The global MRO (Maintenance, Repair, and Overhaul) market size is projected to reach $125.3 billion by 2033.
(Reference: statista.com)
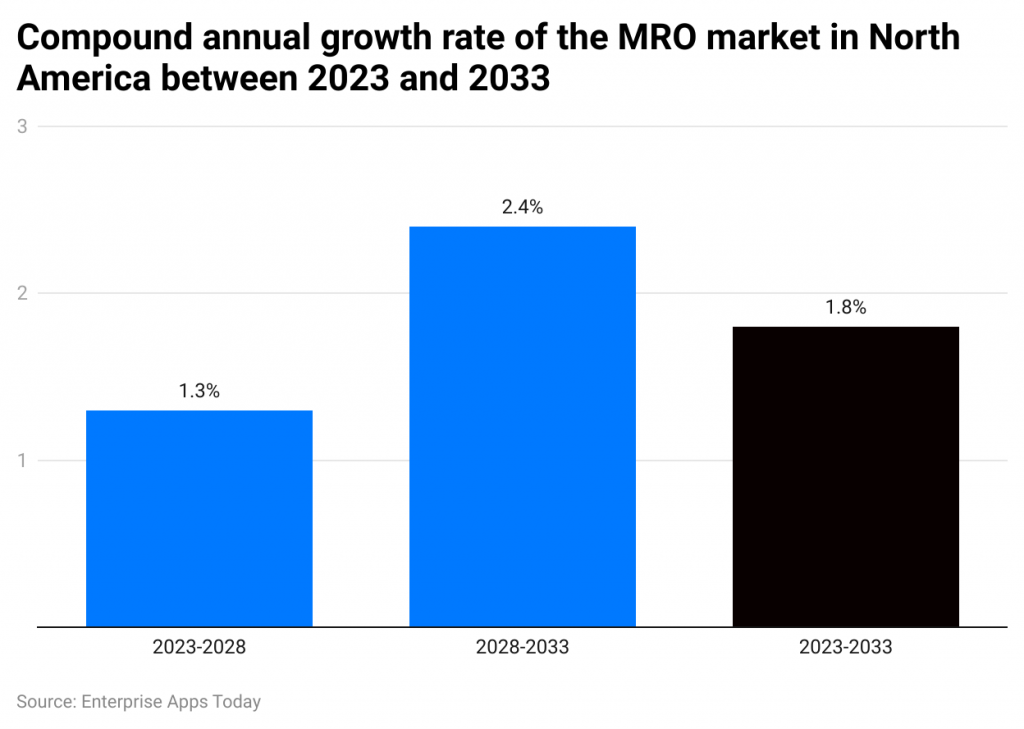
The expected growth rate analysis of the maintenance, repair, and overhaul market in North America over a period of 10 years indicates a CAGR of 1.3% by 2028 and 2.4% between 2028 and 2033. On average, the CAGR growth for these 10 years contributes to 1.8%.
By Pilot Demographics
(Source: faa.gov)
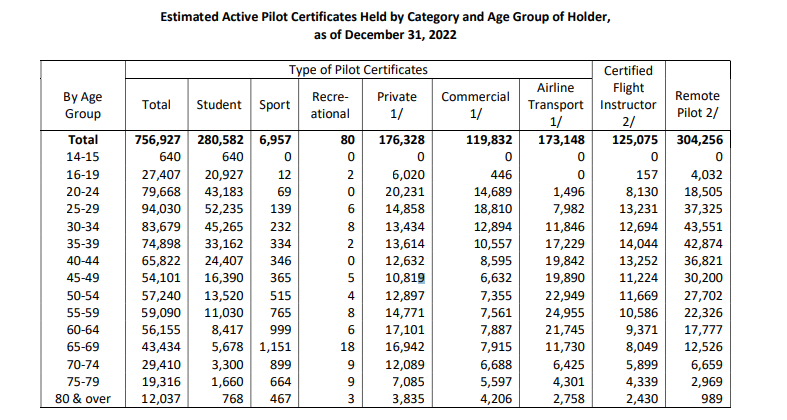
The report by the Federal Aviation Administration of 2023 revealed that in 2022, there were a total of 756,927 pilots, categorized by type of pilot certificates as follows: Student (280,582), Sport (6,957), Recreational (80), Private-1 (176,328), Commercial-1 (119,832), Airline Transport-1 (173,148), Certified Flight Instructor 2 (125,075), and Remote Pilot 2 (304,256), excluding flight instructors and remote pilots. Aviation Statistics indicate a distribution of certified pilots across all age groups, from 14 years to over 80.
(Reference: zippia.com)
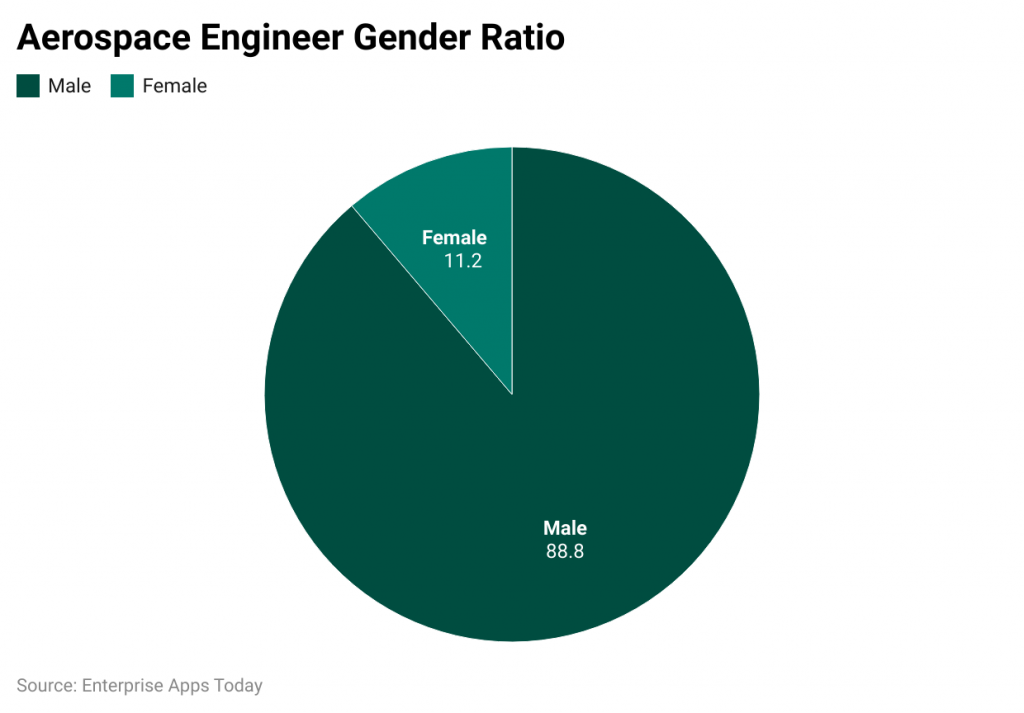
By 2023, the Aviation Statistics reported a male-dominated industry, with 88.8% of aerospace engineers in the USA being male and 11.2% female.
By Type of Airport Delay
(Reference: faa.gov)
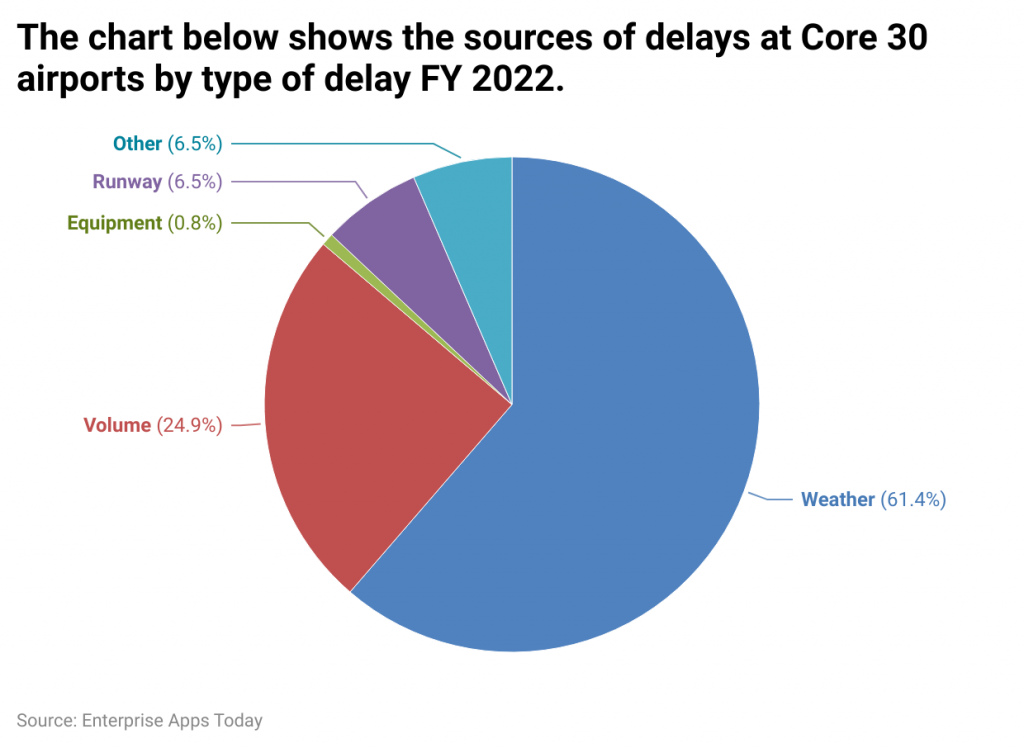
Regarding NAS System delay, any flights reaching their destination 15 minutes past the scheduled time are considered delayed. The primary causes of delays at Core 30 airports were reported as weather conditions (61.4%), Volume Runway issues (24.9%), and 6.5% respectively, along with other factors. Equipment problems accounted for 0.8% of delays.
By Best Airports
(Source: airhelp.com)
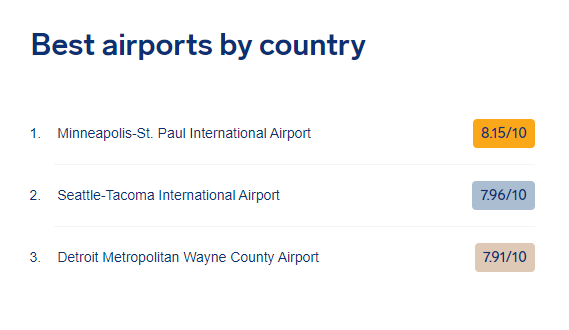
In 2023, the top 3 airports in the USA were Minneapolis-St Paul International Airport (8.15/10), Seattle-Tacoma International Airport (7.96/10), and Detroit Metropolitan Wayne County Airport (7.91/10).
(Source: airhelp.com)
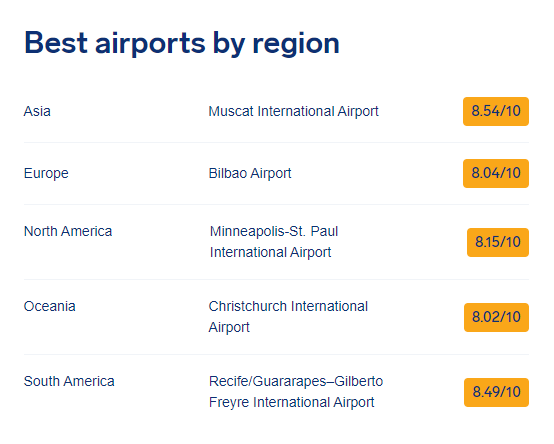
As per 2023 data, Muscat International Airport was recognized as the best airport in the Asian region, scoring 8.54/10. The top airports in different regions in 2023 were Bilbao Airport, Europe (8.04/10), Minneapolis-St. Paul International Airport, North America (8.15/10), Christchurch International Airport, Oceania (8.02/10), and Recife/Guararapes-Gilberto Freyre International Airport, South America (8.49/10).
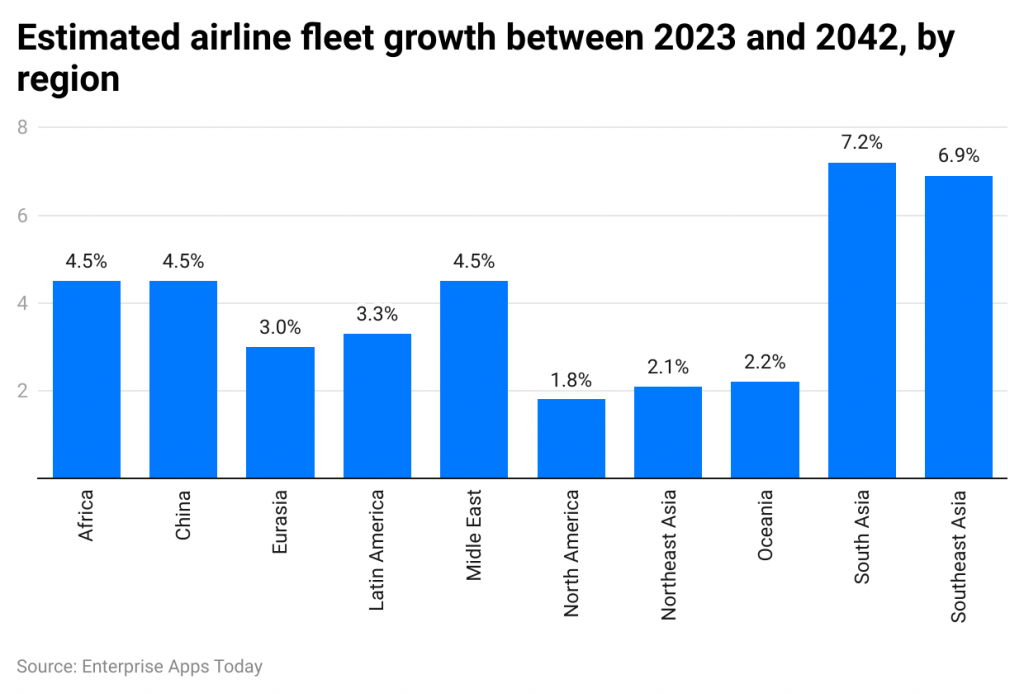
Between 2023 and 2042, airline fleet growth is projected
(Reference: statista.com)
South Asia and Southeast Asia are expected to exhibit the highest growth in airline fleets by 2042, contributing 7.2% and 6.9% respectively. In contrast, North America is projected to witness the lowest growth rate at 1.8%.
Airport Accessibility Statistics
(Source: ICAO.int)
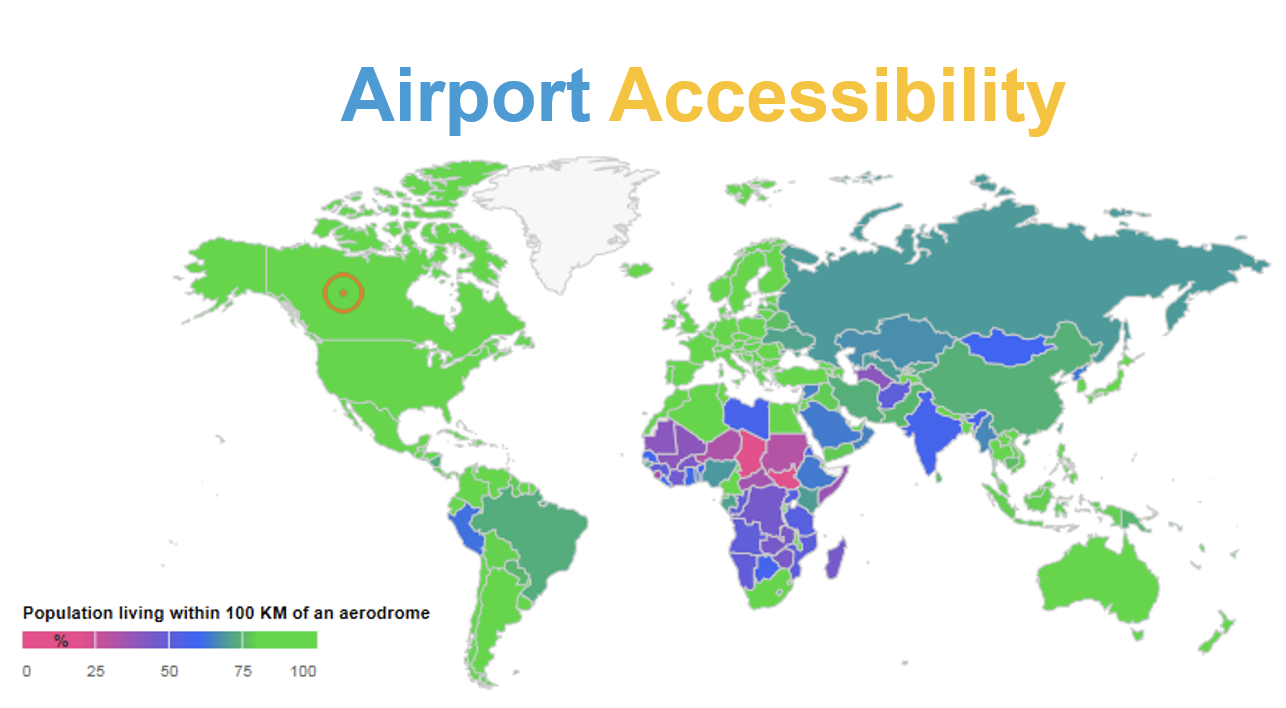
According to the International Civil Aviation Organization, over half of the global population lives within 100km of an international airport. Furthermore, 74% of individuals are located within the same distance of any airport.
Top Airlines Based on Brand Value
(Reference: statista.com)
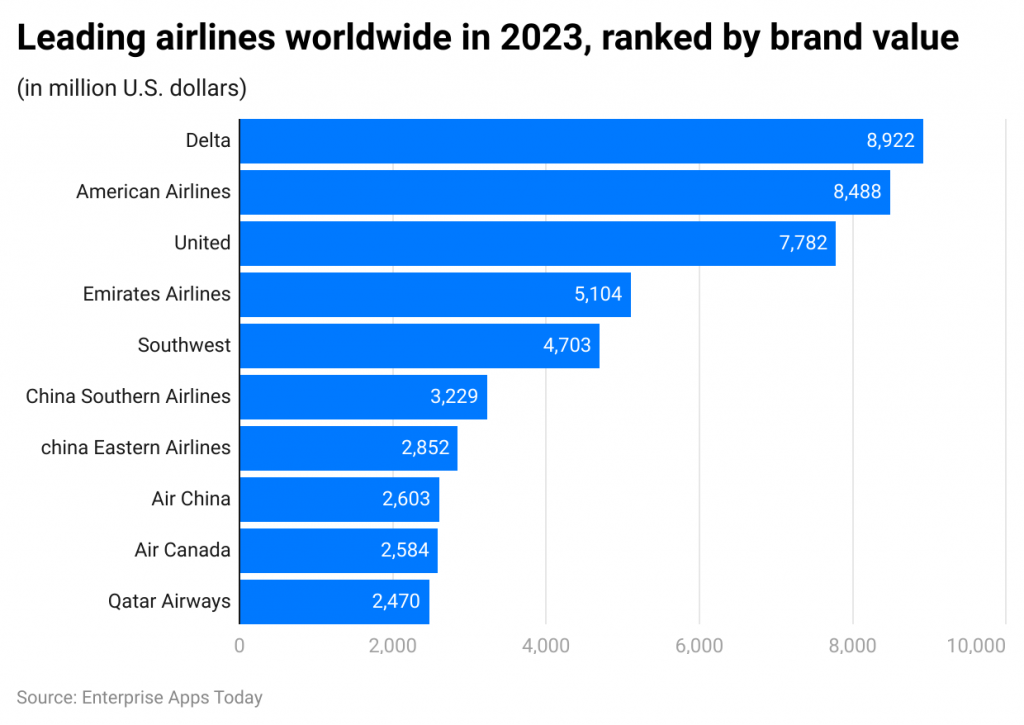
In 2023, Delta led globally in brand value, amounting to $8,922 million. American Airlines followed closely with $8,488 million, and United Airlines with $7,782 million. Airlines outside the USA generally had brand values below $5,000.
Global Airline Rankings
(Reference: airhelp.com)
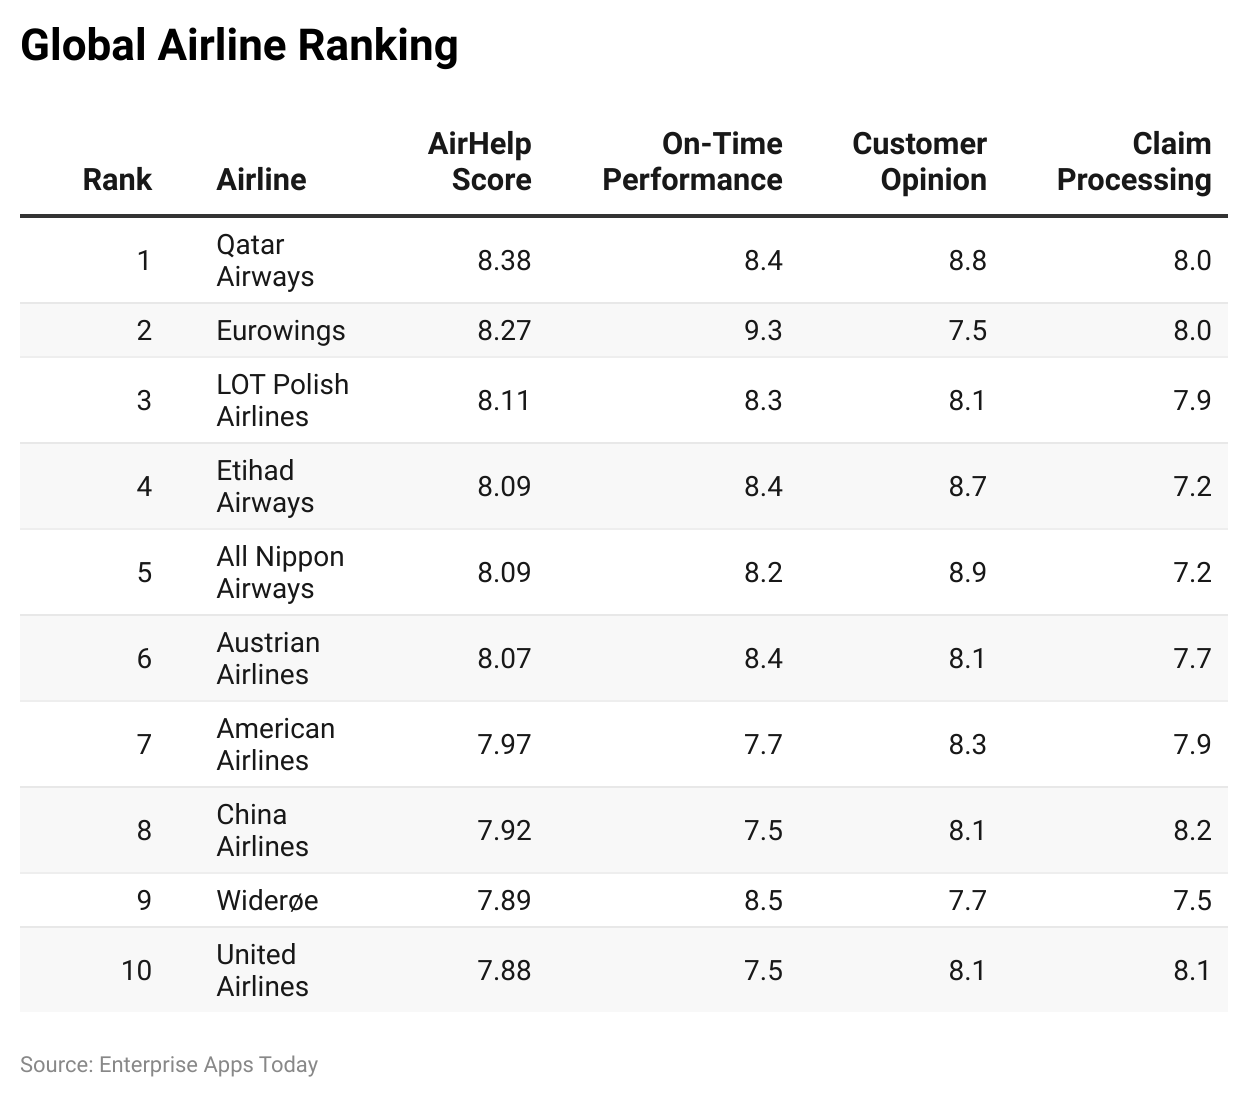
According to Aviation Statistics 2023, Qatar Airways achieved the highest AirHelp Score of 8.38, excelling in on-time performance, customer sentiment, and claim processing. Other top performers included Eurowings (8.27) and LOT Polish Airlines (8.11).
Top Airlines by Performance
(Source: airhelp.com)
In the USA for 2023, American Airlines earned the highest rating with a score of 7.97/10, closely followed by United Airlines (7.88/10) and Delta Air Lines (7.88/10).
(Source: airhelp.com)
By region in 2023, the top airlines were Qatar Airways in Asia (8.38/10), Eurowings in Europe (8.27/10), and American Airlines in North America (7.97/10).
Orders for Aircraft in 2022
(The source of this information is kpmg.com)
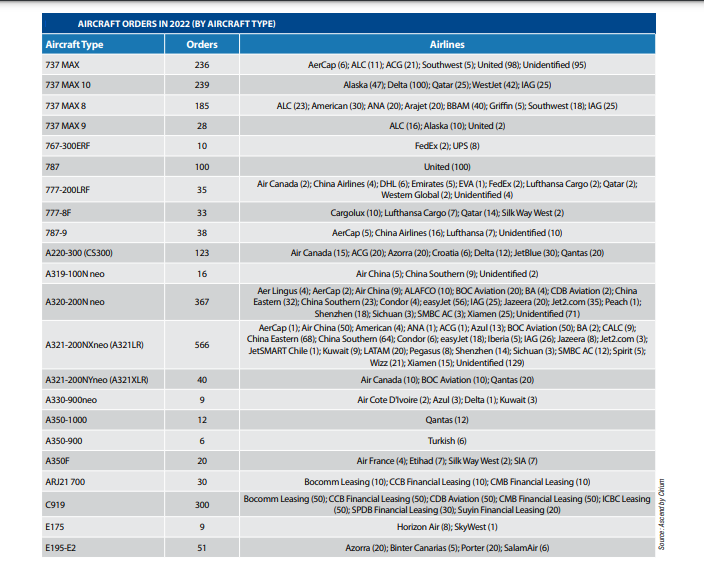
With 566 orders in 2022, the most ordered aircraft type, according to the Aviation Leaders Report 2023, was the A321-200NXneo (A321LR). Airlines favored the A320-200N Neo (367), C919 (300), and 737 Max 10 (239) as the leading ordered aircraft.
By Causes of Delay By Reporting Operating Carrier
(The reference for this data is transportation.gov)
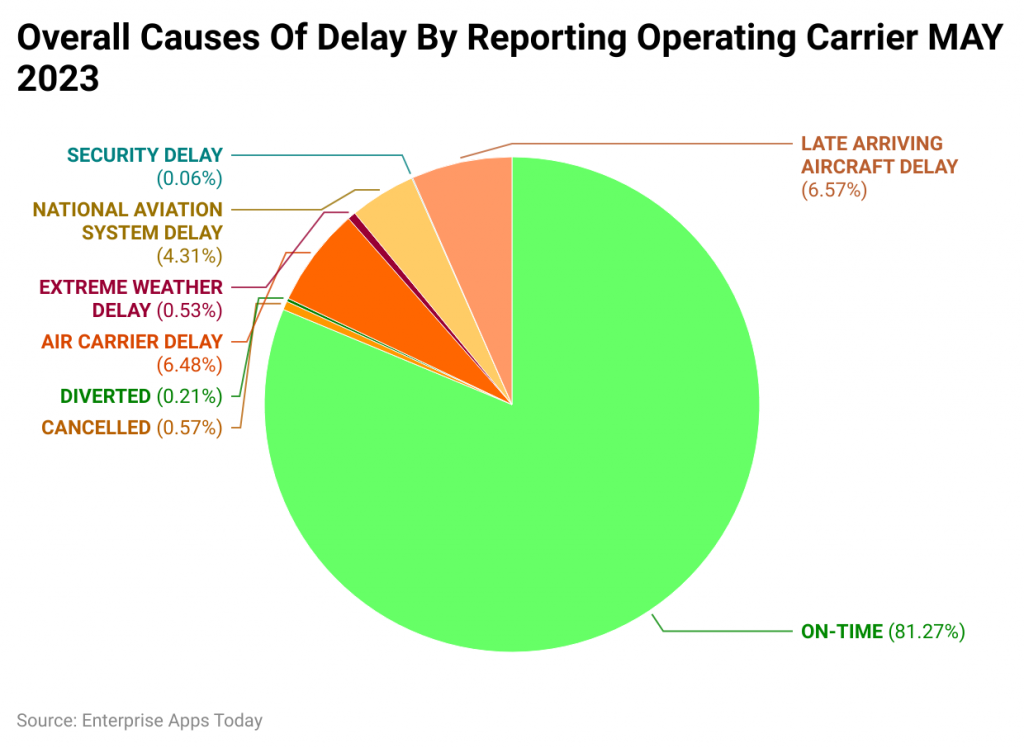
Citing an Air Travel Consumer report, the delays by reporting operating carriers in 2023 were caused by cancelations (0.57%), diversions (0.21%), air carrier delays (6.48%), extreme weather conditions (0.53%), national aviation system delays (4.31%), security delays (0.06%), and delays due to late arriving aircraft (6.57%).
By Projected Aircraft Deliveries by Type
(The reference for this report is statista.com)
Aviation Statistics 2023 projects that by 2042, the total worldwide aircraft deliveries of all types will reach 42,595. Of these deliveries, single-aisle aircraft will dominate (32,420), followed by Widebody (7,440). Regional jets (1,810) and freighters (925) will have lower delivery numbers compared to other types.
By Aircraft Shipments

(The source for this data is gama.aero)
In 2022, 1,524 piston airplanes and 582 turboprop airplanes were shipped worldwide. Additionally, there were 932 total helicopter shipments. The value of aircraft shipments was $22,865,799,694, while the cumulative valuation of helicopters was $4,519,247,299.
Worldwide Active Military Aircraft Fleet in 2024
(The source of this information is globalfirepower.com)
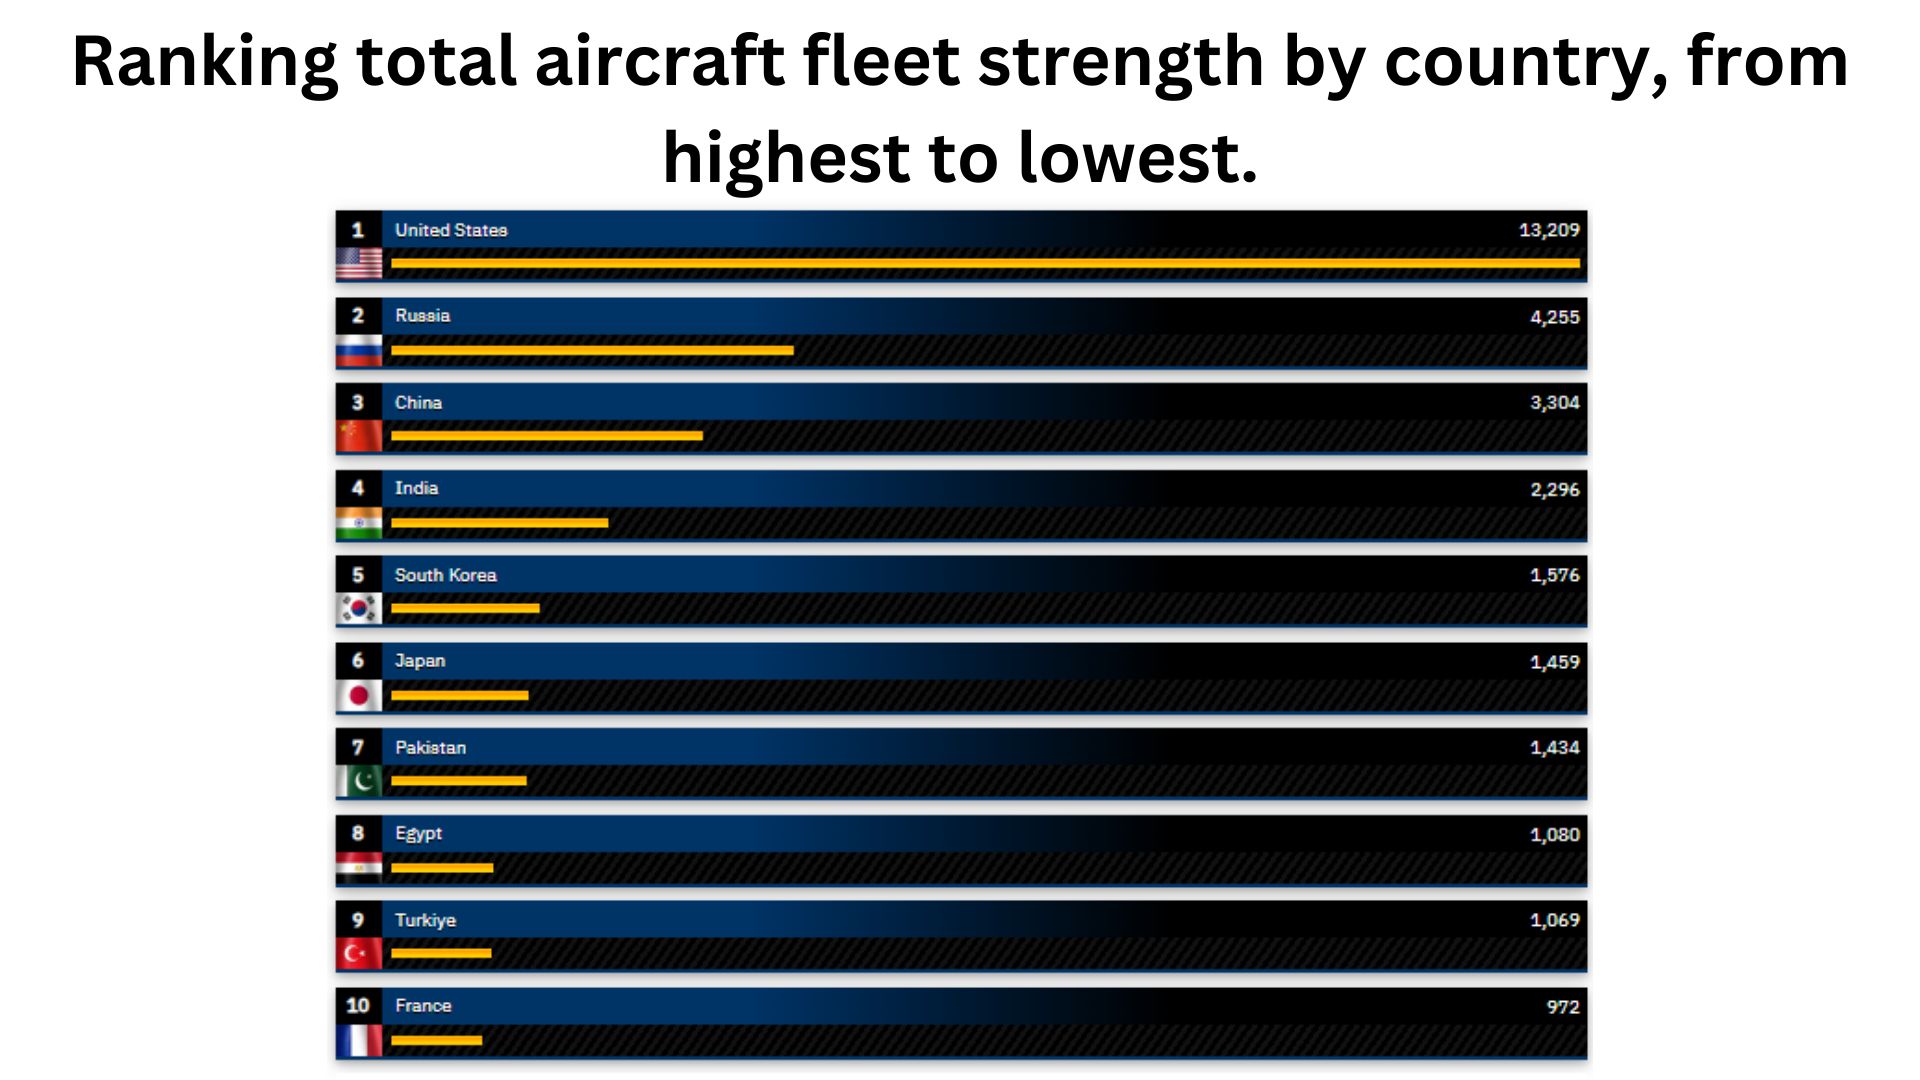
As per Aviation Statistics 2024, the countries with the largest military aircraft fleets in 2024 are the United States of America (13,209), Russia (4,255), China (3,304), India (2,296), and South Korea.
By Busiest Air Routine in the World vs in the US in 2023
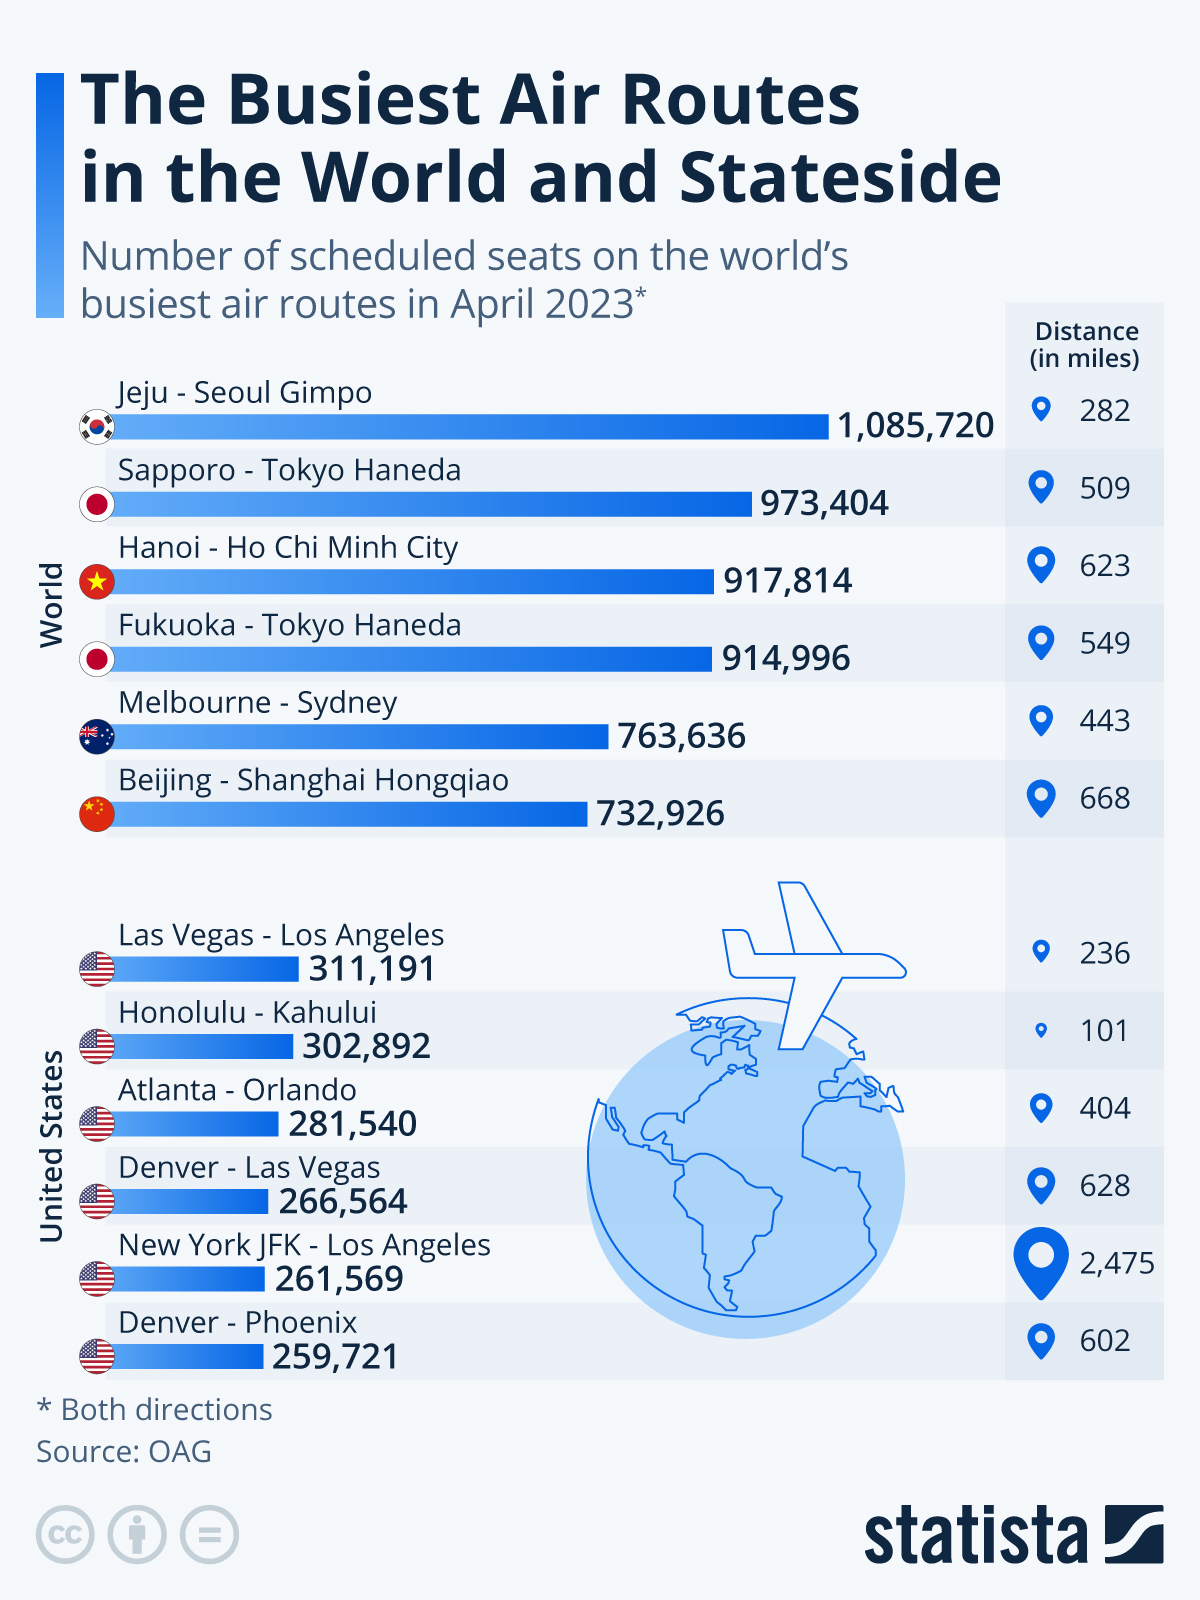
(Source: statista.com)
Conclusion
The rise of globalization has transformed aviation-related industries into billion-dollar sectors. These industries not only facilitate general travel but also play a crucial role in shipping goods internationally and supporting military operations. The data presented in the Aviation Statistics indicates a promising future for the industry across all countries.
Furthermore, in the upcoming years, the aviation sector is poised to create millions of job opportunities due to advancements in technology, enhancements in the supply chain sector, military services, and various other factors. As a result, individuals pursuing a career in aviation can anticipate a bright and fulfilling future.
Sources
Various types of airplanes include Jets, Amphibious, Bombers, Piston aircraft, Private jets, regional airlines, narrow-body aircraft, commuter liners, parachutes, aerobatic planes, cargo airplanes, turboprop aircraft, unmanned aircraft, passenger planes, airbus, jumbo jets, light jets, Concorde, and multi-engine piston. These encompass both commercial and private airplane models.
Difference between aircraft and airplanes
Aircraft is a general term for flying vehicles like helicopters and airplanes, while airplanes specifically refer to vehicles with wings for flight and multiple engines.
The three main types of aviation are military, commercial, and general aviation.
Average pilot salary in 2024
The average annual salary for a pilot in 2024 is $134,630.
Aviation Statistics 2024 By Market Size, Valuation, Pilot Demographics, Best Airports, Leading Airlines by Brand Value, Best Airlines and Best Airports
The data provided covers the years 2023 and 2024, with forecasts extending to 2025, 2026, 2027, and 2028.
——
REFERENCES:
This information was taken from various sources around the world, including these countries:
Australia, Canada, USA, UK, UAE, India, Pakistan, Philippines, Indonesia, Nigeria, Tanzania, Kenya, US, United Kingdom, United States of America, Malaysia, U.S., South Africa, New Zealand, Turkey, United Arab Emirates.
Afghanistan, Albania, Algeria, American Samoa, Andorra, Angola, Anguilla, Antarctica, Antigua and Barbuda, Argentina, Armenia, Aruba, Australia, Austria, Azerbaijan.
Bahamas, Bahrain, Bangladesh, Barbados, Belarus, Belgium, Belize, Benin, Bermuda, Bhutan, Bolivia, Bosnia and Herzegovina, Botswana, Bouvet Island, Brazil, British Indian Ocean Territory, Brunei Darussalam, Bulgaria, Burkina Faso, Burundi.
Cambodia, Cameroon, Canada, Cape Verde, Cayman Islands, Central African Republic, Chad, Chile, China, Christmas Island, Cocos (Keeling Islands), Colombia, Comoros, Congo, Cook Islands, Costa Rica, Cote D’Ivoire (Ivory Coast), Croatia (Hrvatska), Cuba, Cyprus, Czech Republic.
Denmark, Djibouti, Dominica, Dominican Republic, East Timor, Ecuador, Egypt, El Salvador, Equatorial Guinea, Eritrea, Estonia, Ethiopia, Falkland Islands (Malvinas), Faroe Islands, Fiji, Finland, France, Metropolitan, French Guiana, French Polynesia, French Southern Territories.
Gabon, Gambia, Georgia, Germany, Ghana, Gibraltar, Greece, Greenland, Grenada, Guadeloupe, Guam, Guatemala, Guinea, Guinea-Bissau, Guyana, Haiti, Heard and McDonald Islands, Honduras, Hong Kong, Hungary, Iceland, India, Indonesia, Iran, Iraq, Ireland, Israel, Italy.
Jamaica, Japan, Jordan, Kazakhstan, Kenya, Kiribati, North Korea, South Korea, Kuwait, Kyrgyzstan, Laos, Latvia, Lebanon, Lesotho, Liberia, Libya, Liechtenstein, Lithuania, Luxembourg.
Macau, Macedonia, Madagascar, Malawi, Malaysia, Maldives, Mali, Malta, Marshall Islands, Martinique, Mauritania, Mauritius, Mayotte, Mexico, Micronesia, Moldova, Monaco, Mongolia, Montserrat, Morocco, Mozambique, Myanmar.
Namibia, Nauru, Nepal, Netherlands, Netherlands Antilles, New Caledonia, New Zealand (NZ), Nicaragua, Niger, Nigeria, Niue, Norfolk Island, Northern Mariana Islands, Norway.
Oman, Pakistan, Palau, Panama, Papua New Guinea, Paraguay, Peru, Philippines, Pitcairn, Poland, Portugal, Puerto Rico, Qatar, Reunion, Romania, Russia, Rwanda, Saint Kitts and Nevis, Saint Lucia, Saint Vincent and The Grenadines, Samoa, San Marino, Sao Tome and Principe.
Saudi Arabia, Senegal, Serbia, Seychelles, Sierra Leone, Singapore, Slovakia, Slovenia, Solomon Islands, Somalia, South Africa, South Georgia and South Sandwich Islands, Spain, Sri Lanka, St. Helena, St. Pierre and Miquelon, Sudan, Suriname, Svalbard and Jan Mayen Islands, Swaziland, Sweden, Switzerland, Syria.
Taiwan, Tajikistan, Tanzania, Thailand, Togo, Tokelau, Tonga, Trinidad and Tobago, Tunisia, Turkey, Turkmenistan, Turks and Caicos Islands, Tuvalu, Uganda, Ukraine, United Arab Emirates (UAE), UK (United Kingdom), USA (United States of America, U.S.), US Minor Outlying Islands.
Uruguay, Uzbekistan, Vanuatu, Vatican City State (Holy See), Venezuela, Vietnam, Virgin Islands (British), Virgin Islands (US), Wallis and Futuna Islands, Western Sahara, Yemen, Yugoslavia, Zaire, Zambia, Zimbabwe.
Aviation Statistics 2024 By Market Size, Valuation, Pilot Demographics, Best Airports, Leading Airlines by Brand Value, Best Airlines and Best Airports
August 28, 2024

