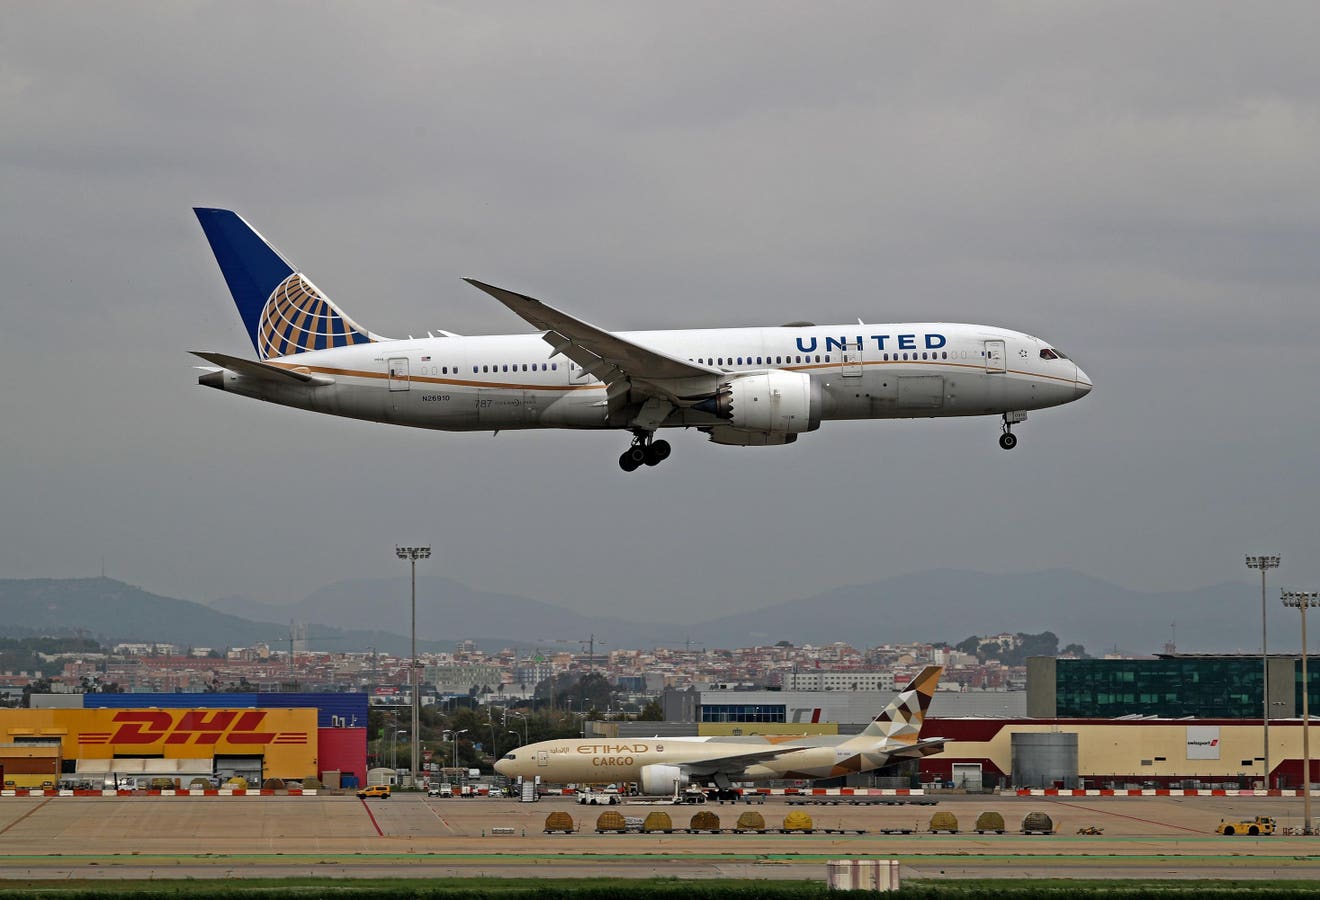
A Boeing 787-8 Dreamliner from United Airlines lands at Barcelona airport in Barcelona, Spain, on … [+]
United Airlines stock (NASDAQ: UAL) recently reported its Q3 results, with revenues aligning and earnings exceeding our estimates. The company reported revenue of $14.8 billion and adjusted earnings of $3.33 per share, compared to our estimates of $14.8 billion and $3.15, respectively. The revenue trends were positive for the company. In this note, we discuss United Airlines’ stock performance, key takeaways from its recent results, and valuation.
How Did United Airlines Fare In Q3?
United Airlines’ revenue of $14.8 billion in Q3 was up 2.5% y-o-y. This was led by increased capacity, with average seat miles up 4.1%, partly offset by a 2% decline in passenger revenue per seat mile. The company saw its adjusted pre-tax margin fall to 9.7% in Q3’24 from 10.8% in the prior-year quarter. Although its average fuel price per gallon fell 13.2% y-o-y, its non-fuel costs, including wages and aircraft maintenance, trended higher. The company’s bottom line stood at $3.33 on an adjusted basis, versus $3.65 in Q3’23.
Looking forward, United Airlines expects its Q4 adjusted EPS to be in the range of $2.50 and $3.00, compared to the consensus estimate of $2.68. Overall, United Airlines reported a good Q3 and better than anticipated Q4 guidance. Furthermore, it announced a $1.5 billion share repurchase program.
What Does This Mean For UAL Stock?
Earnings beat, clubbed with a good outlook and a share repurchase program, helped UAL stock soar over 15% post its results announcement. We now estimate United Airlines’ Valuation to be $81 per share, reflecting around 10% upside from its current levels of around $73. Our forecast is based on a 8x P/E multiple for UAL and expected earnings of $10.29 on a per-share and adjusted basis for the full year 2024. Based on the company’s Q4 guidance, its adjusted earnings per share for 2024 is expected to be in the range of $9.82 and $10.32.
UAL has had a solid run this year, with 78% gains, versus 22% for the broader S&P 500 index. Notably, the annual returns for the stock were considerably less volatile than the S&P 500 in the last three years. Similarly, the Trefis High Quality Portfolio, with a collection of 30 stocks, is less volatile. But, it has outperformed the S&P 500 each year over the same period. Why is that? As a group, HQ Portfolio stocks provided better returns with less risk versus the benchmark index; less of a roller-coaster ride, as evident in HQ Portfolio performance metrics.
While United Airlines stock may see higher levels, check out how other United Airlines Peers fare on metrics that matter. You will find other valuable comparisons for companies across industries at Peer Comparisons.
UAL Return Compared With Trefis Reinforced Portfolio
Invest with Trefis Market Beating Portfolios
See all Trefis Price Estimates

