Everyone knows that the United States
is the world’s largest aviation market. According to OAG data, it has approximately 26,000 daily scheduled passenger flights in November, equivalent to more than one in four of the total.
The US has ~1,600 fewer services daily than before the pandemic in November 2019. However, due to larger gauge aircraft with more seats/departure and lower seat-mile cost, seats for sale have risen by 6%, with an additional six million on offer.
Related
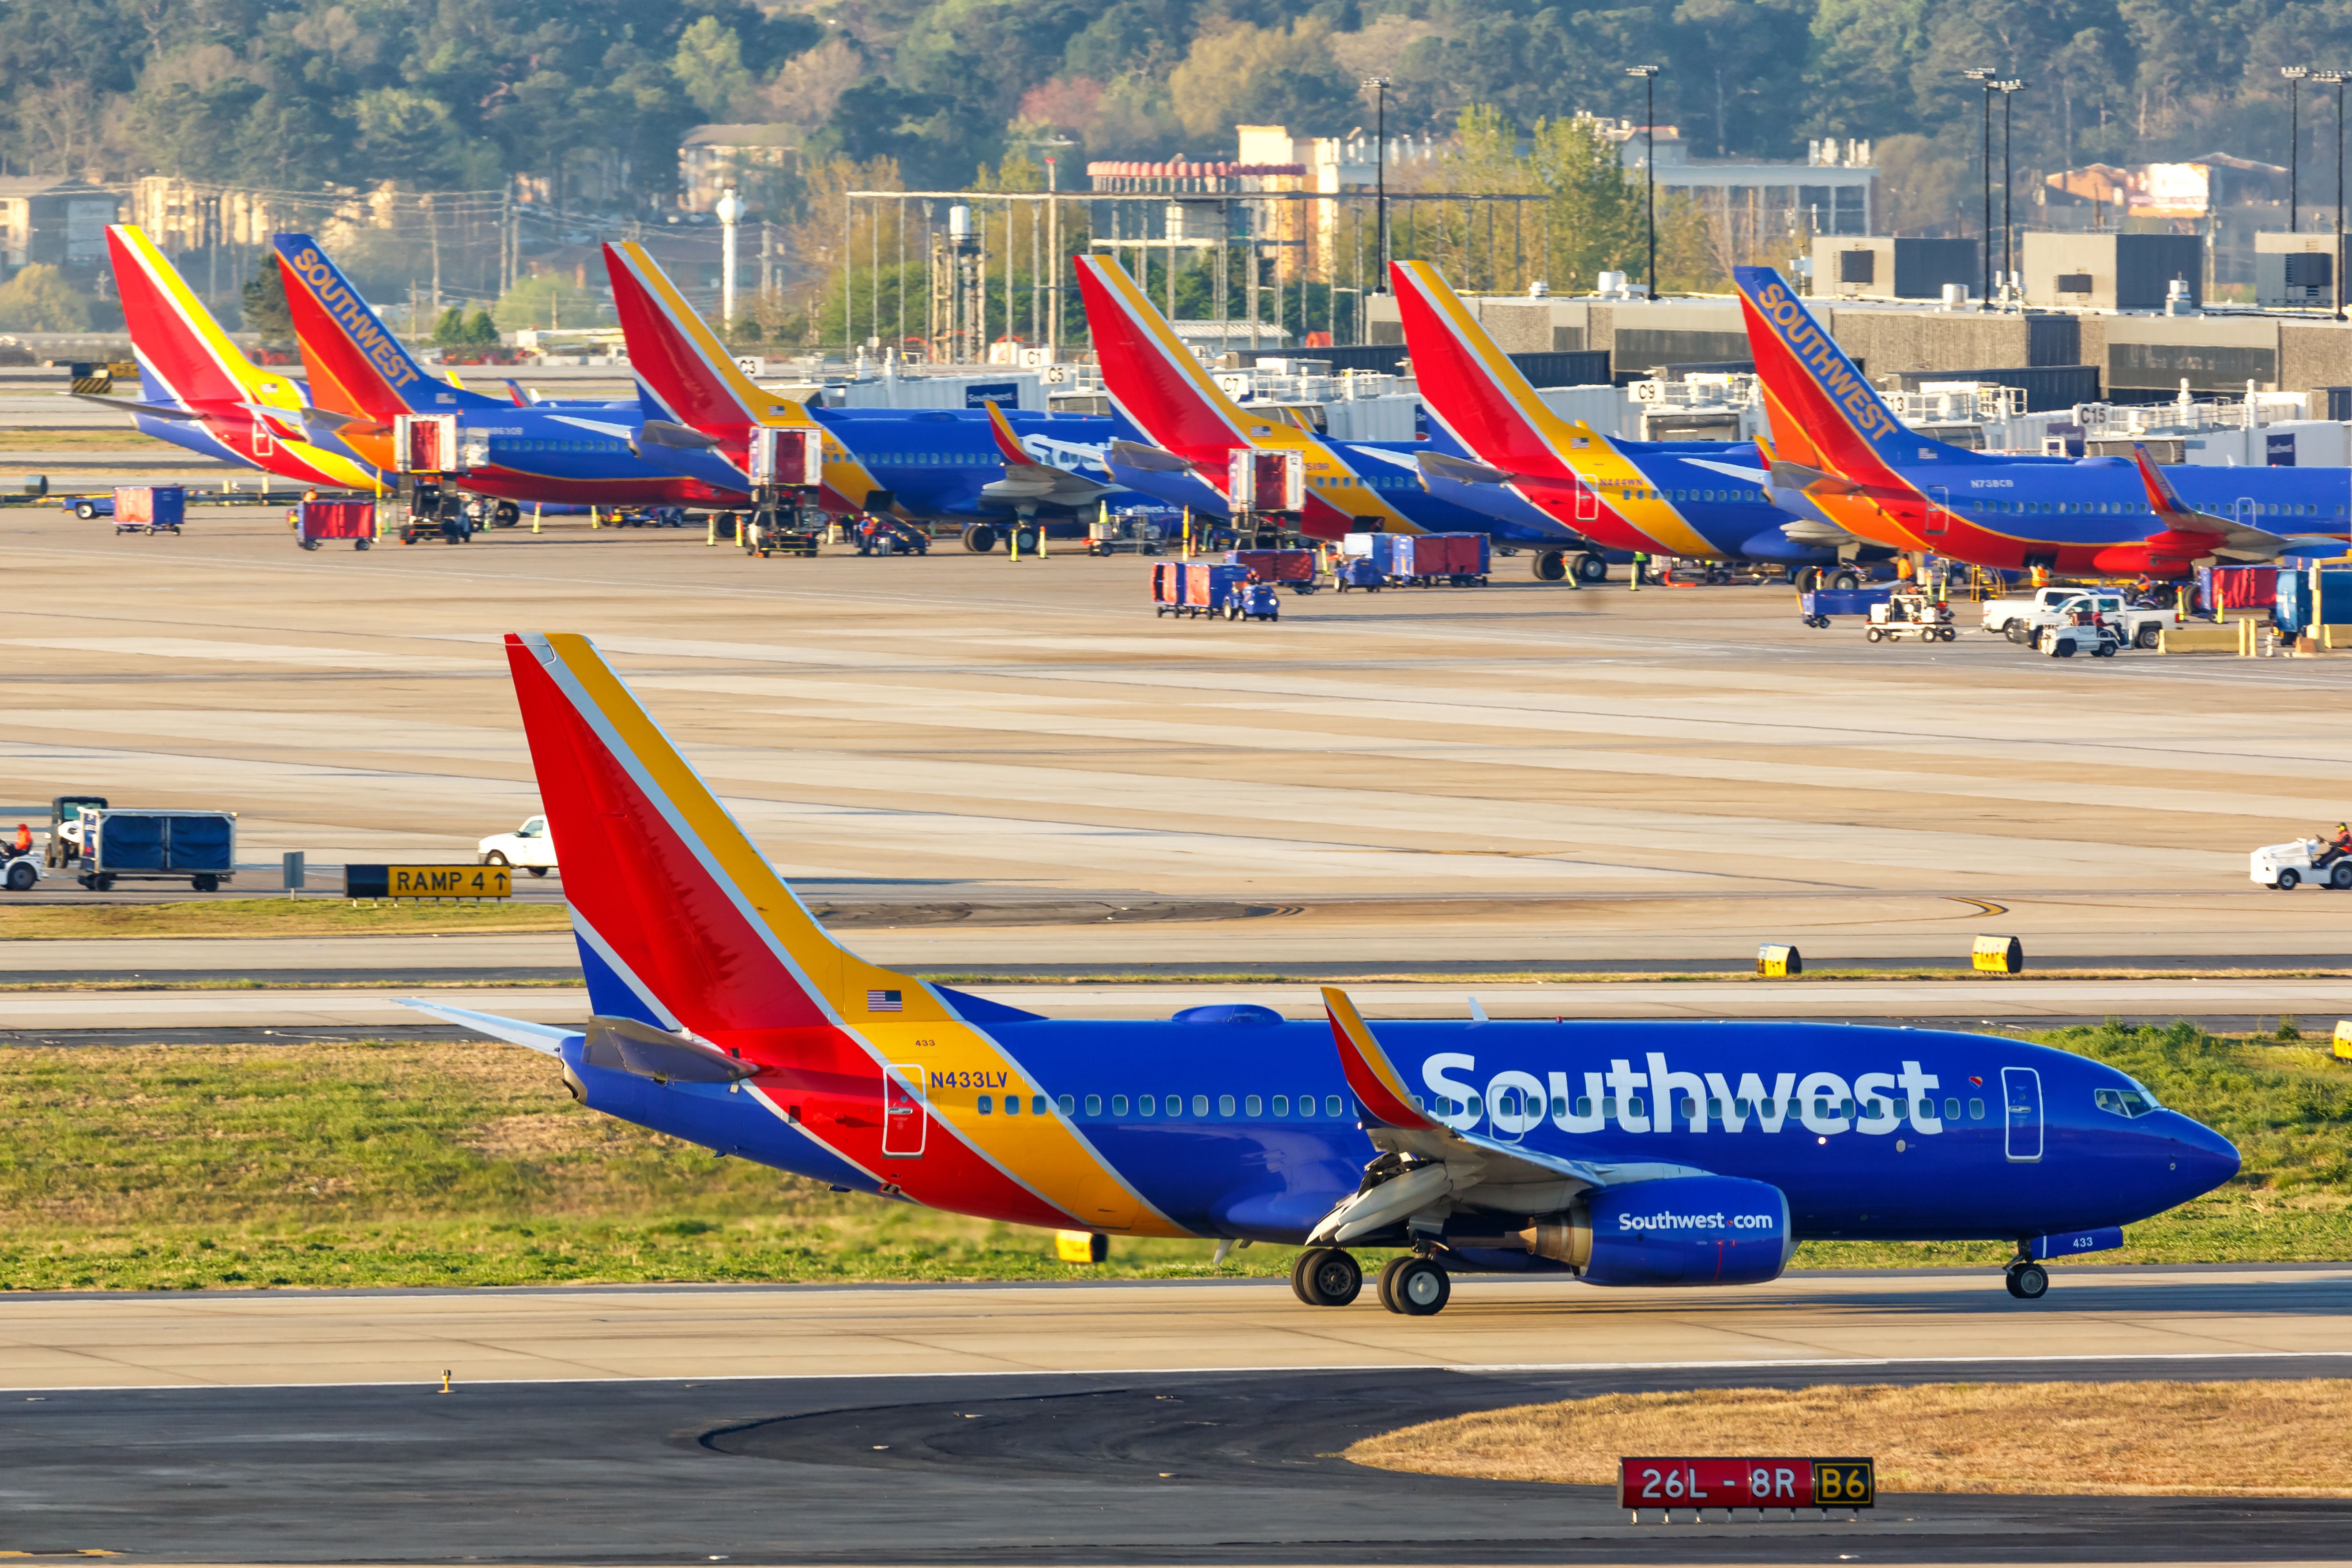
Southwest Airlines Adds Its New Longest Route In The Lower 48 US States
The carrier has added eight routes, three of which have never been served by any airline.
The US’s top 10 airlines: November
They are shown below. ![]() American Airlines
American Airlines
, ![]() Delta Air Lines
Delta Air Lines
, and ![]() United Airlines
United Airlines
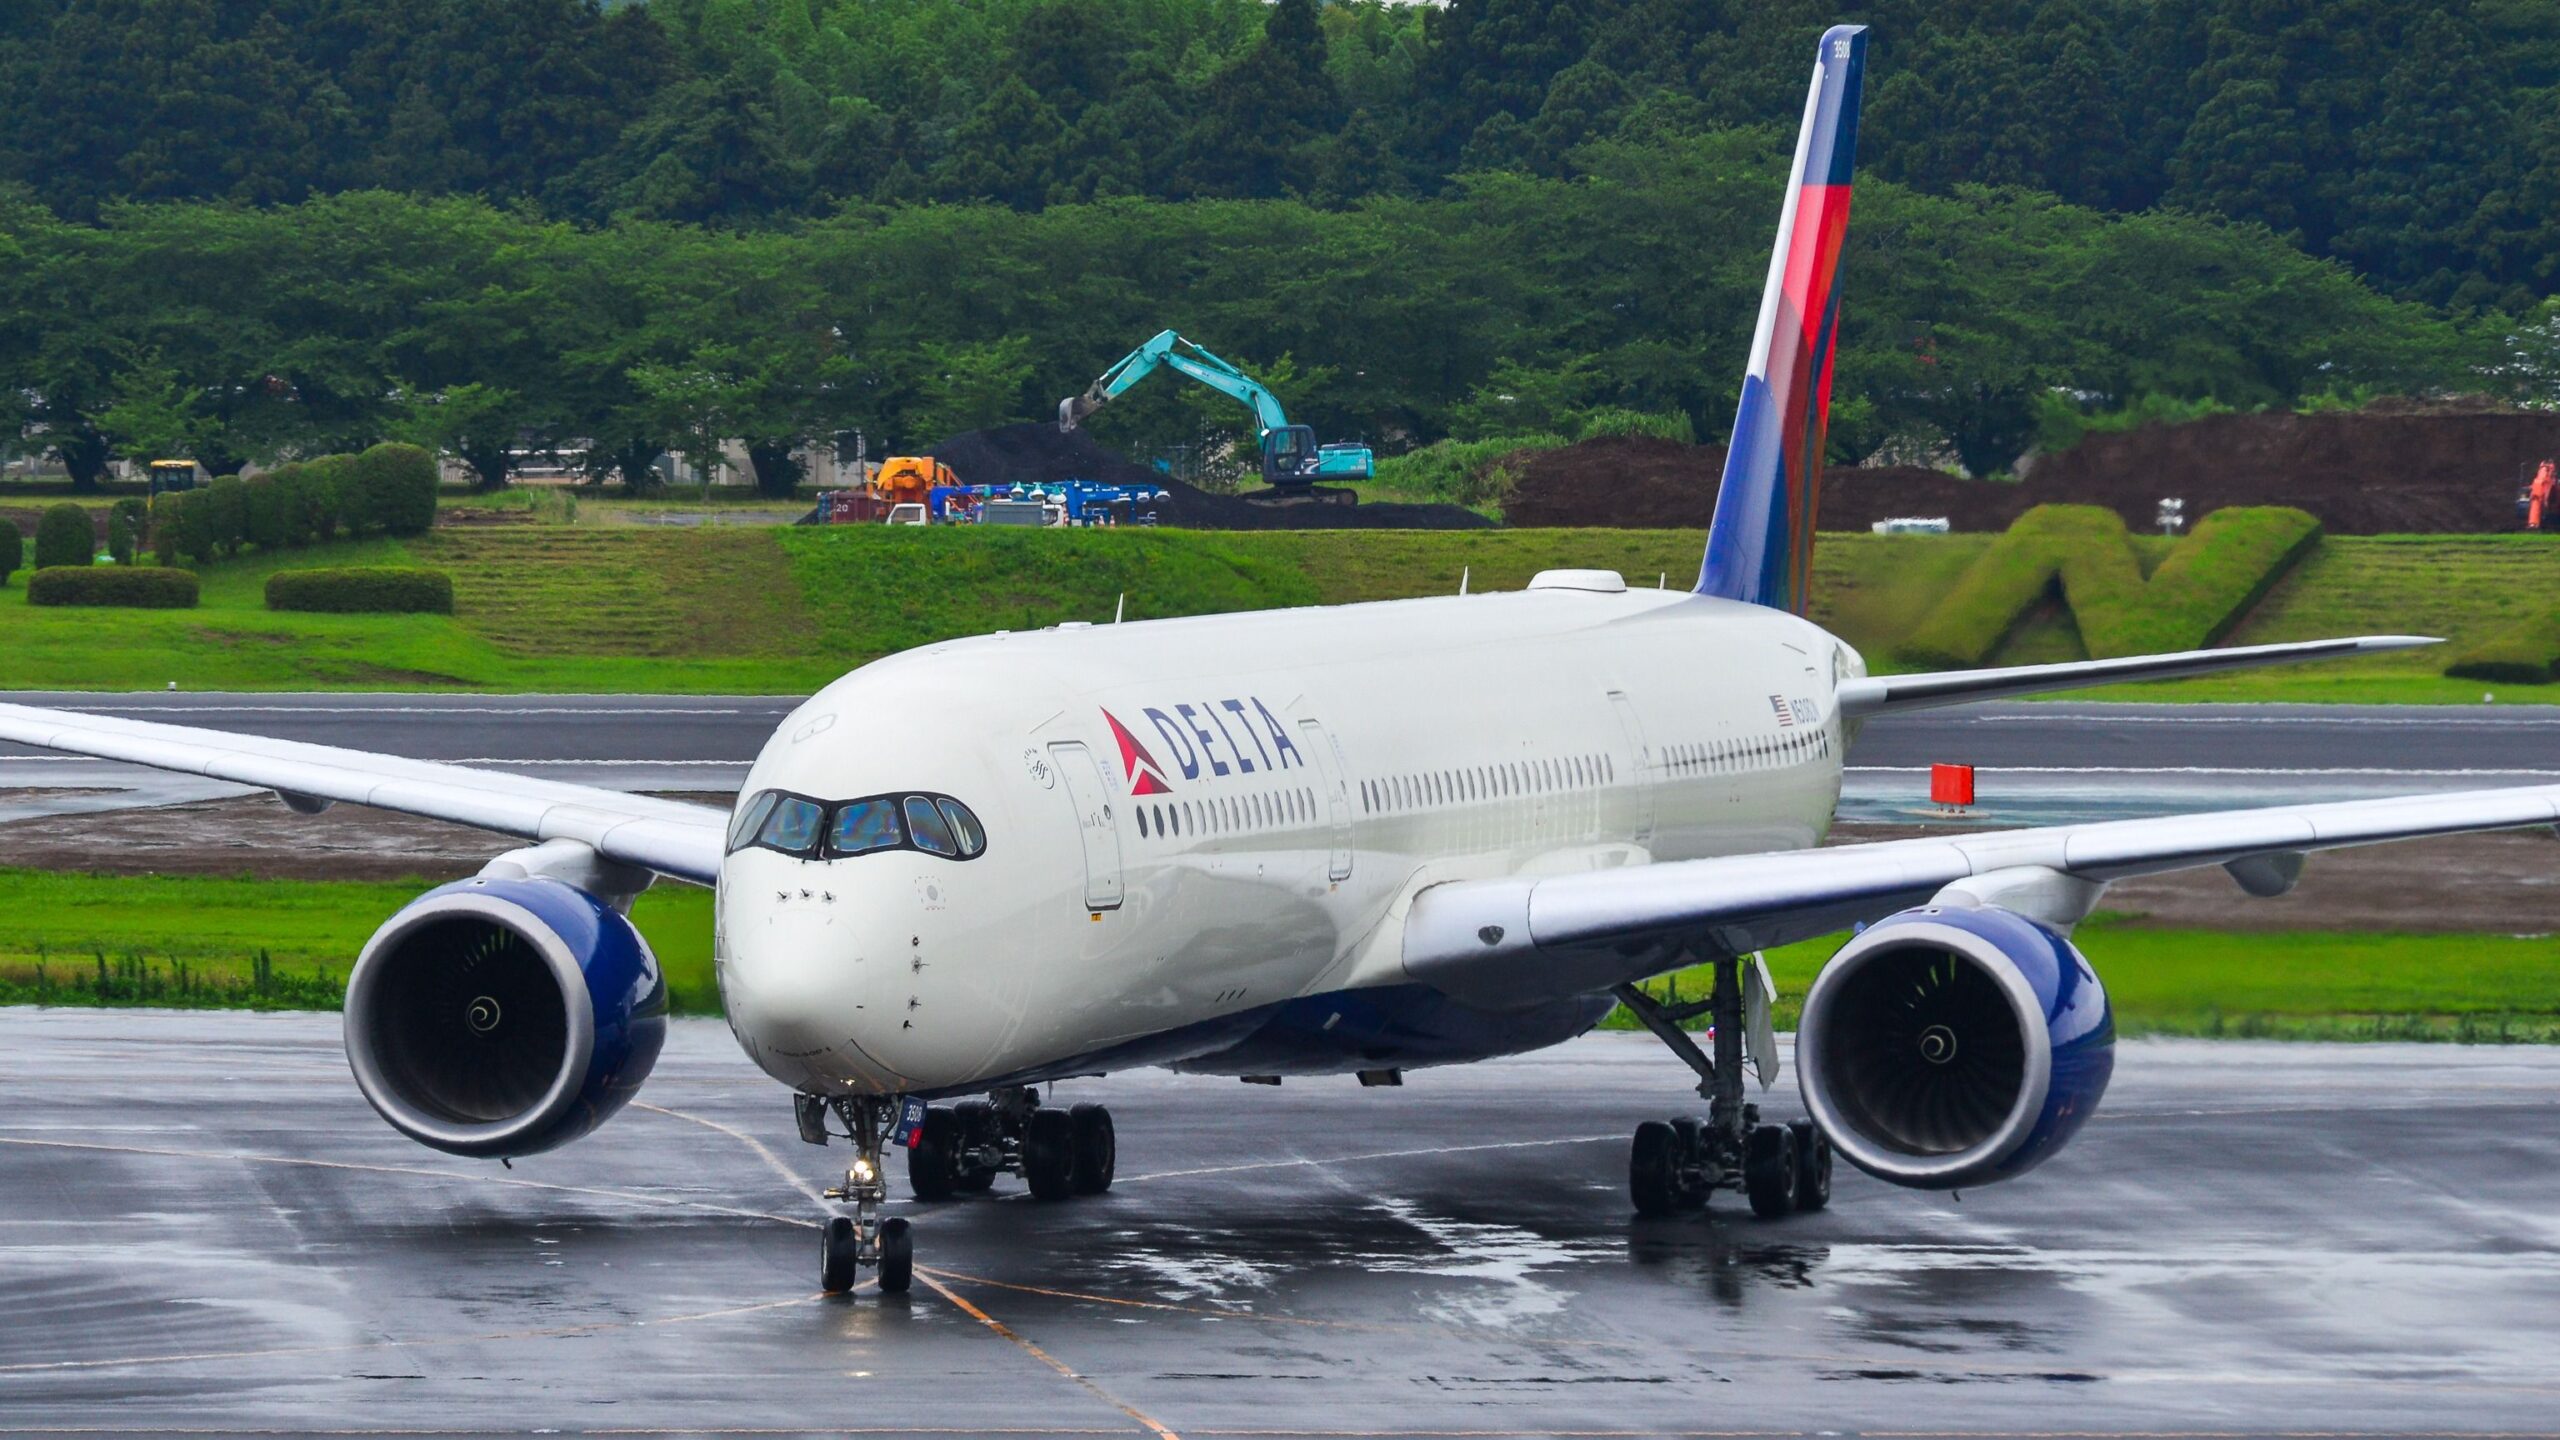
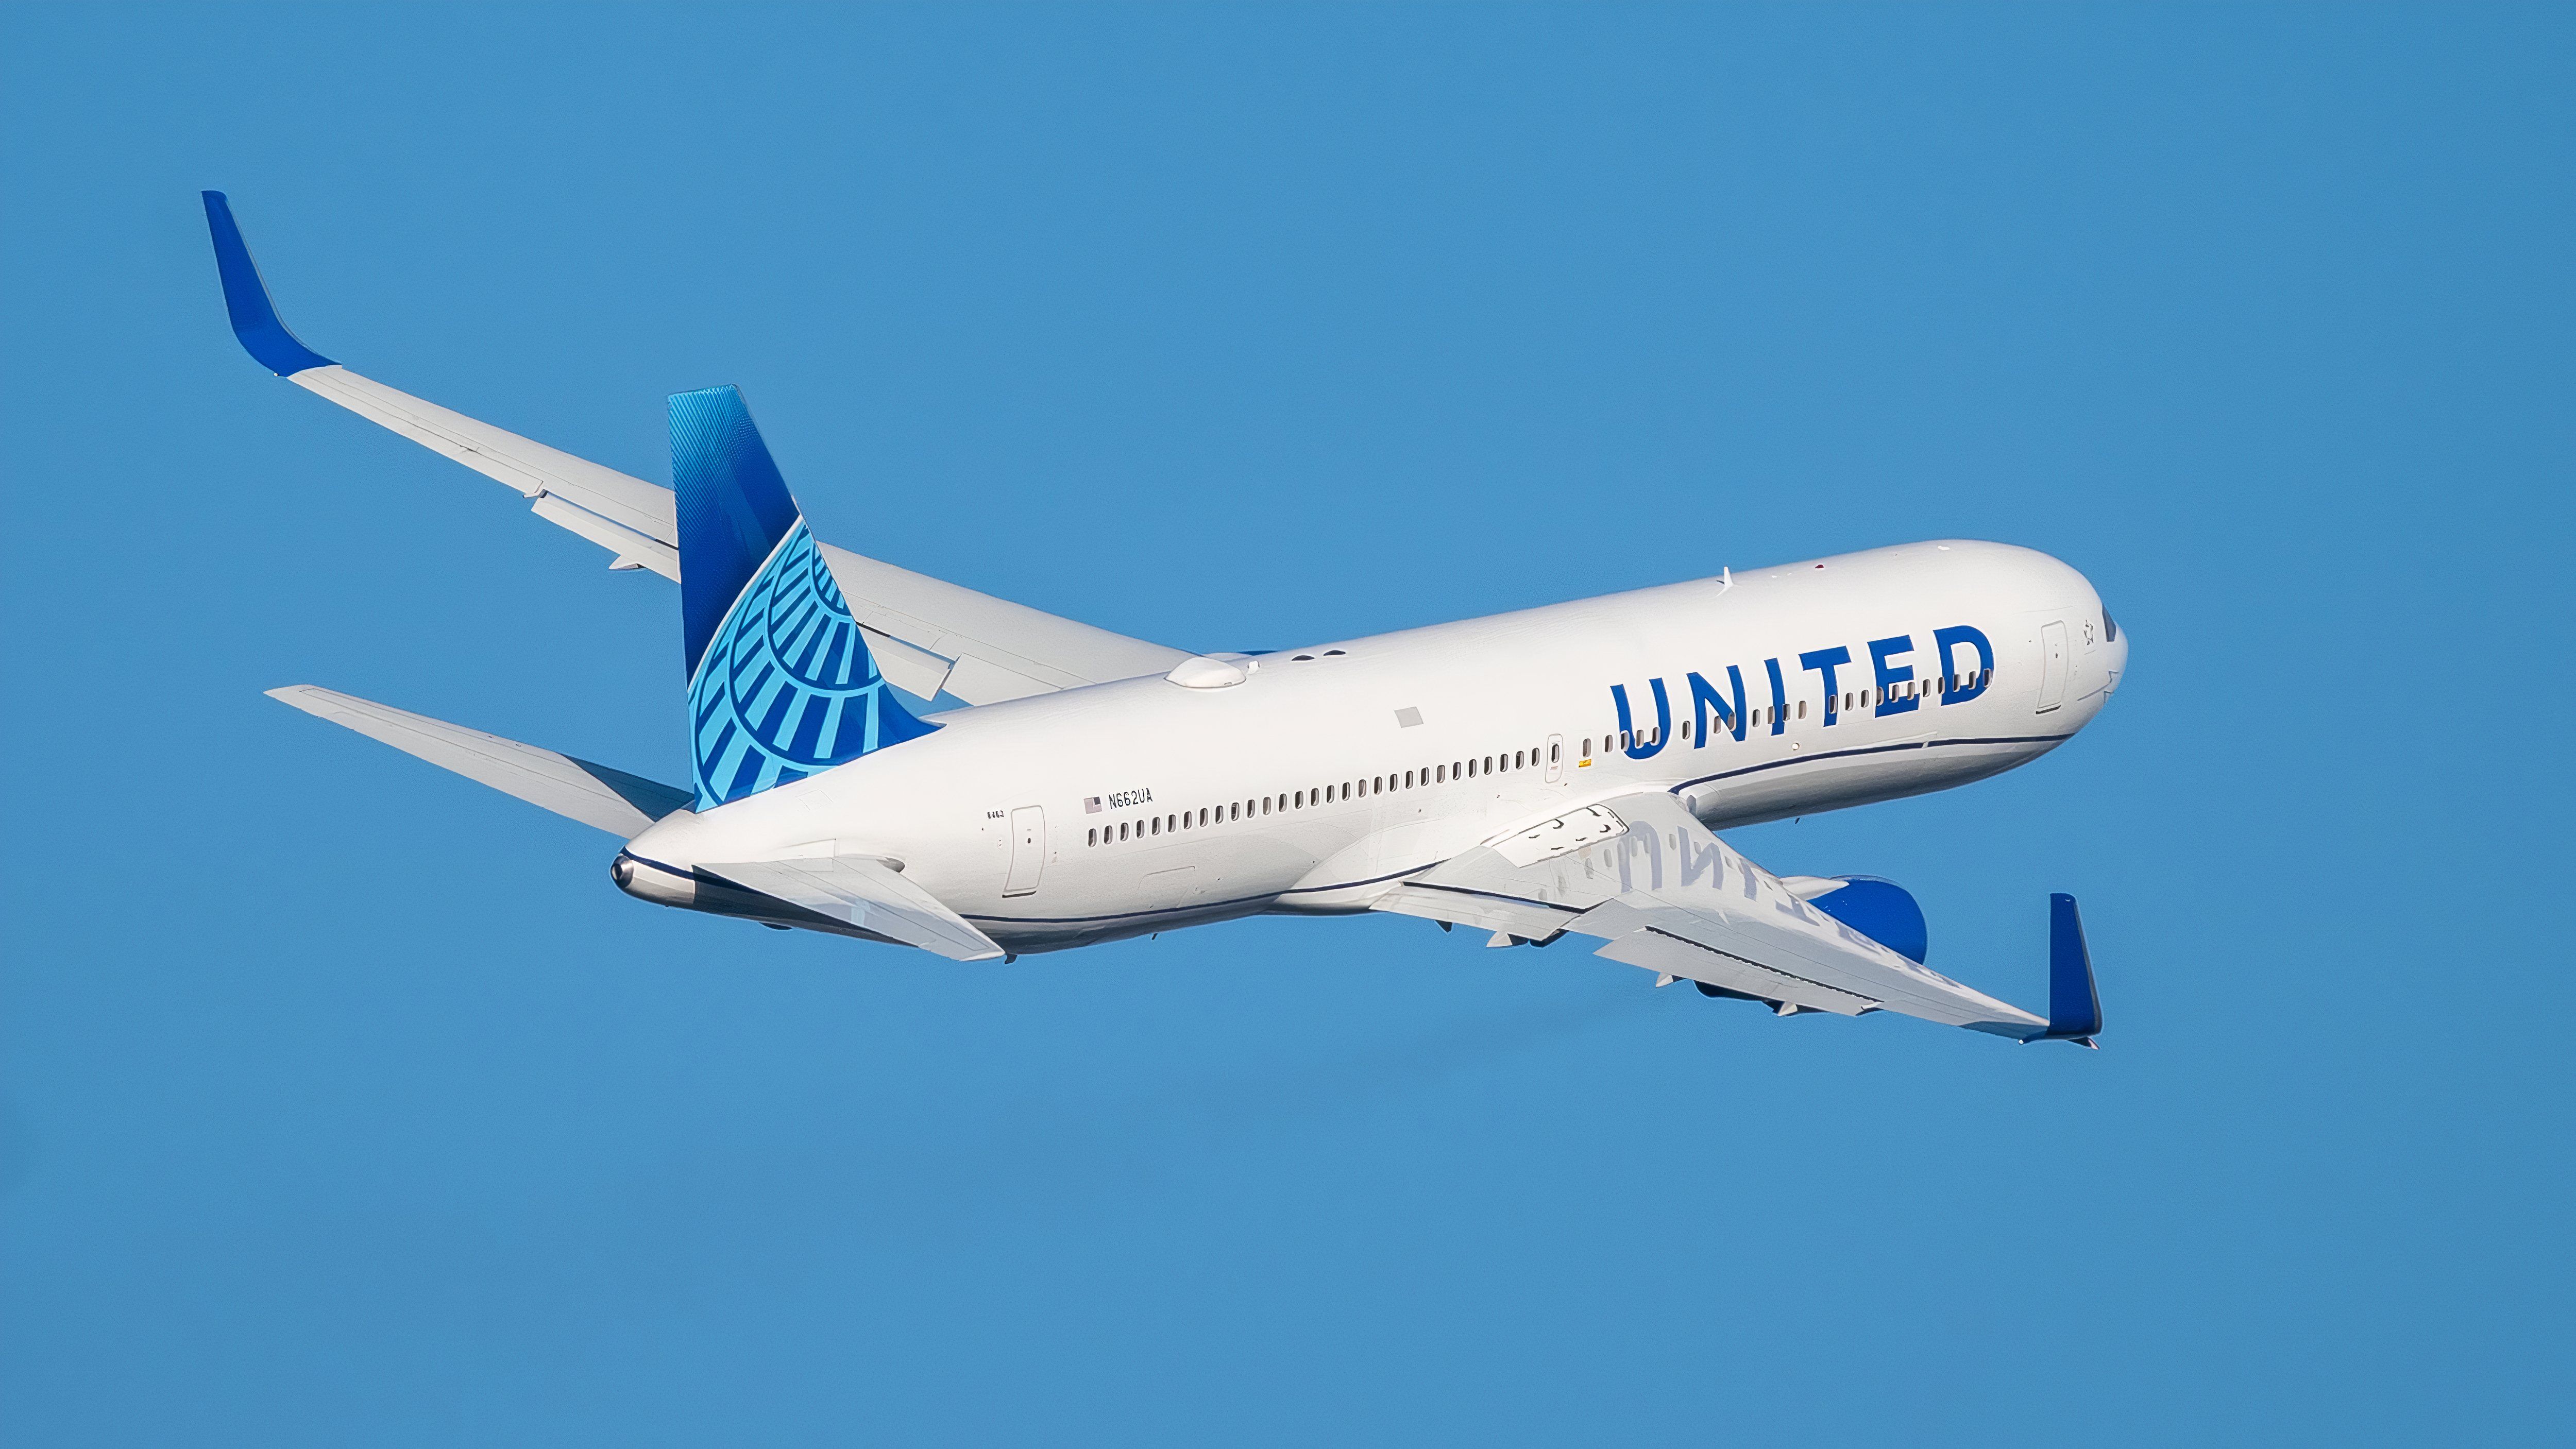
have 58% of the country’s services and more than one in seven of the world’s total. The trio has introduced new routes in the past week, with American’s additions including its longest-ever non-stop service.
Related
United Airlines’ New Dakar Route: Does It Make Sense?
This is what two network planning consultants said.
OAG indicates that  Southwest Airlines
ranked third in November 2023, with United in fourth place. The change is because Southwest has cut its schedule by 330 daily roundtrips year-on-year (-8%).
Multiple factors influenced the reduction, including insufficient profitability, cost pressure, aircraft delays, and Elliot’s demands. In contrast, United has 467 more daily services than last November (+12%).
|
Airline* |
November roundtrip flights*** |
% international |
US & foreign airports served (November only) |
Routes (November only)^ |
|---|---|---|---|---|
|
American |
5,820 |
12% |
341 |
1,077 |
|
Delta |
4,617 |
9% |
286 |
841 |
|
United |
4,537 |
14% |
328 |
853 |
|
Southwest |
3,839 |
2% |
117 |
812 |
|
Alaska Airlines** |
1,181 |
7% |
123 |
287 |
|
JetBlue |
859 |
26% |
89 |
212 |
|
Spirit |
712 |
9% |
143 |
295 |
|
Frontier |
606 |
3% |
94 |
320 |
|
Allegiant |
292 |
0% |
120 |
397 |
|
Hawaiian** |
226 |
3% |
31 |
49 |
|
* Incl. regional units ** Despite the merger, they are still separate brands |
*** Services/30 days |
^ A minimum of four one-way flights |
1/4 of JetBlue’s flights are international
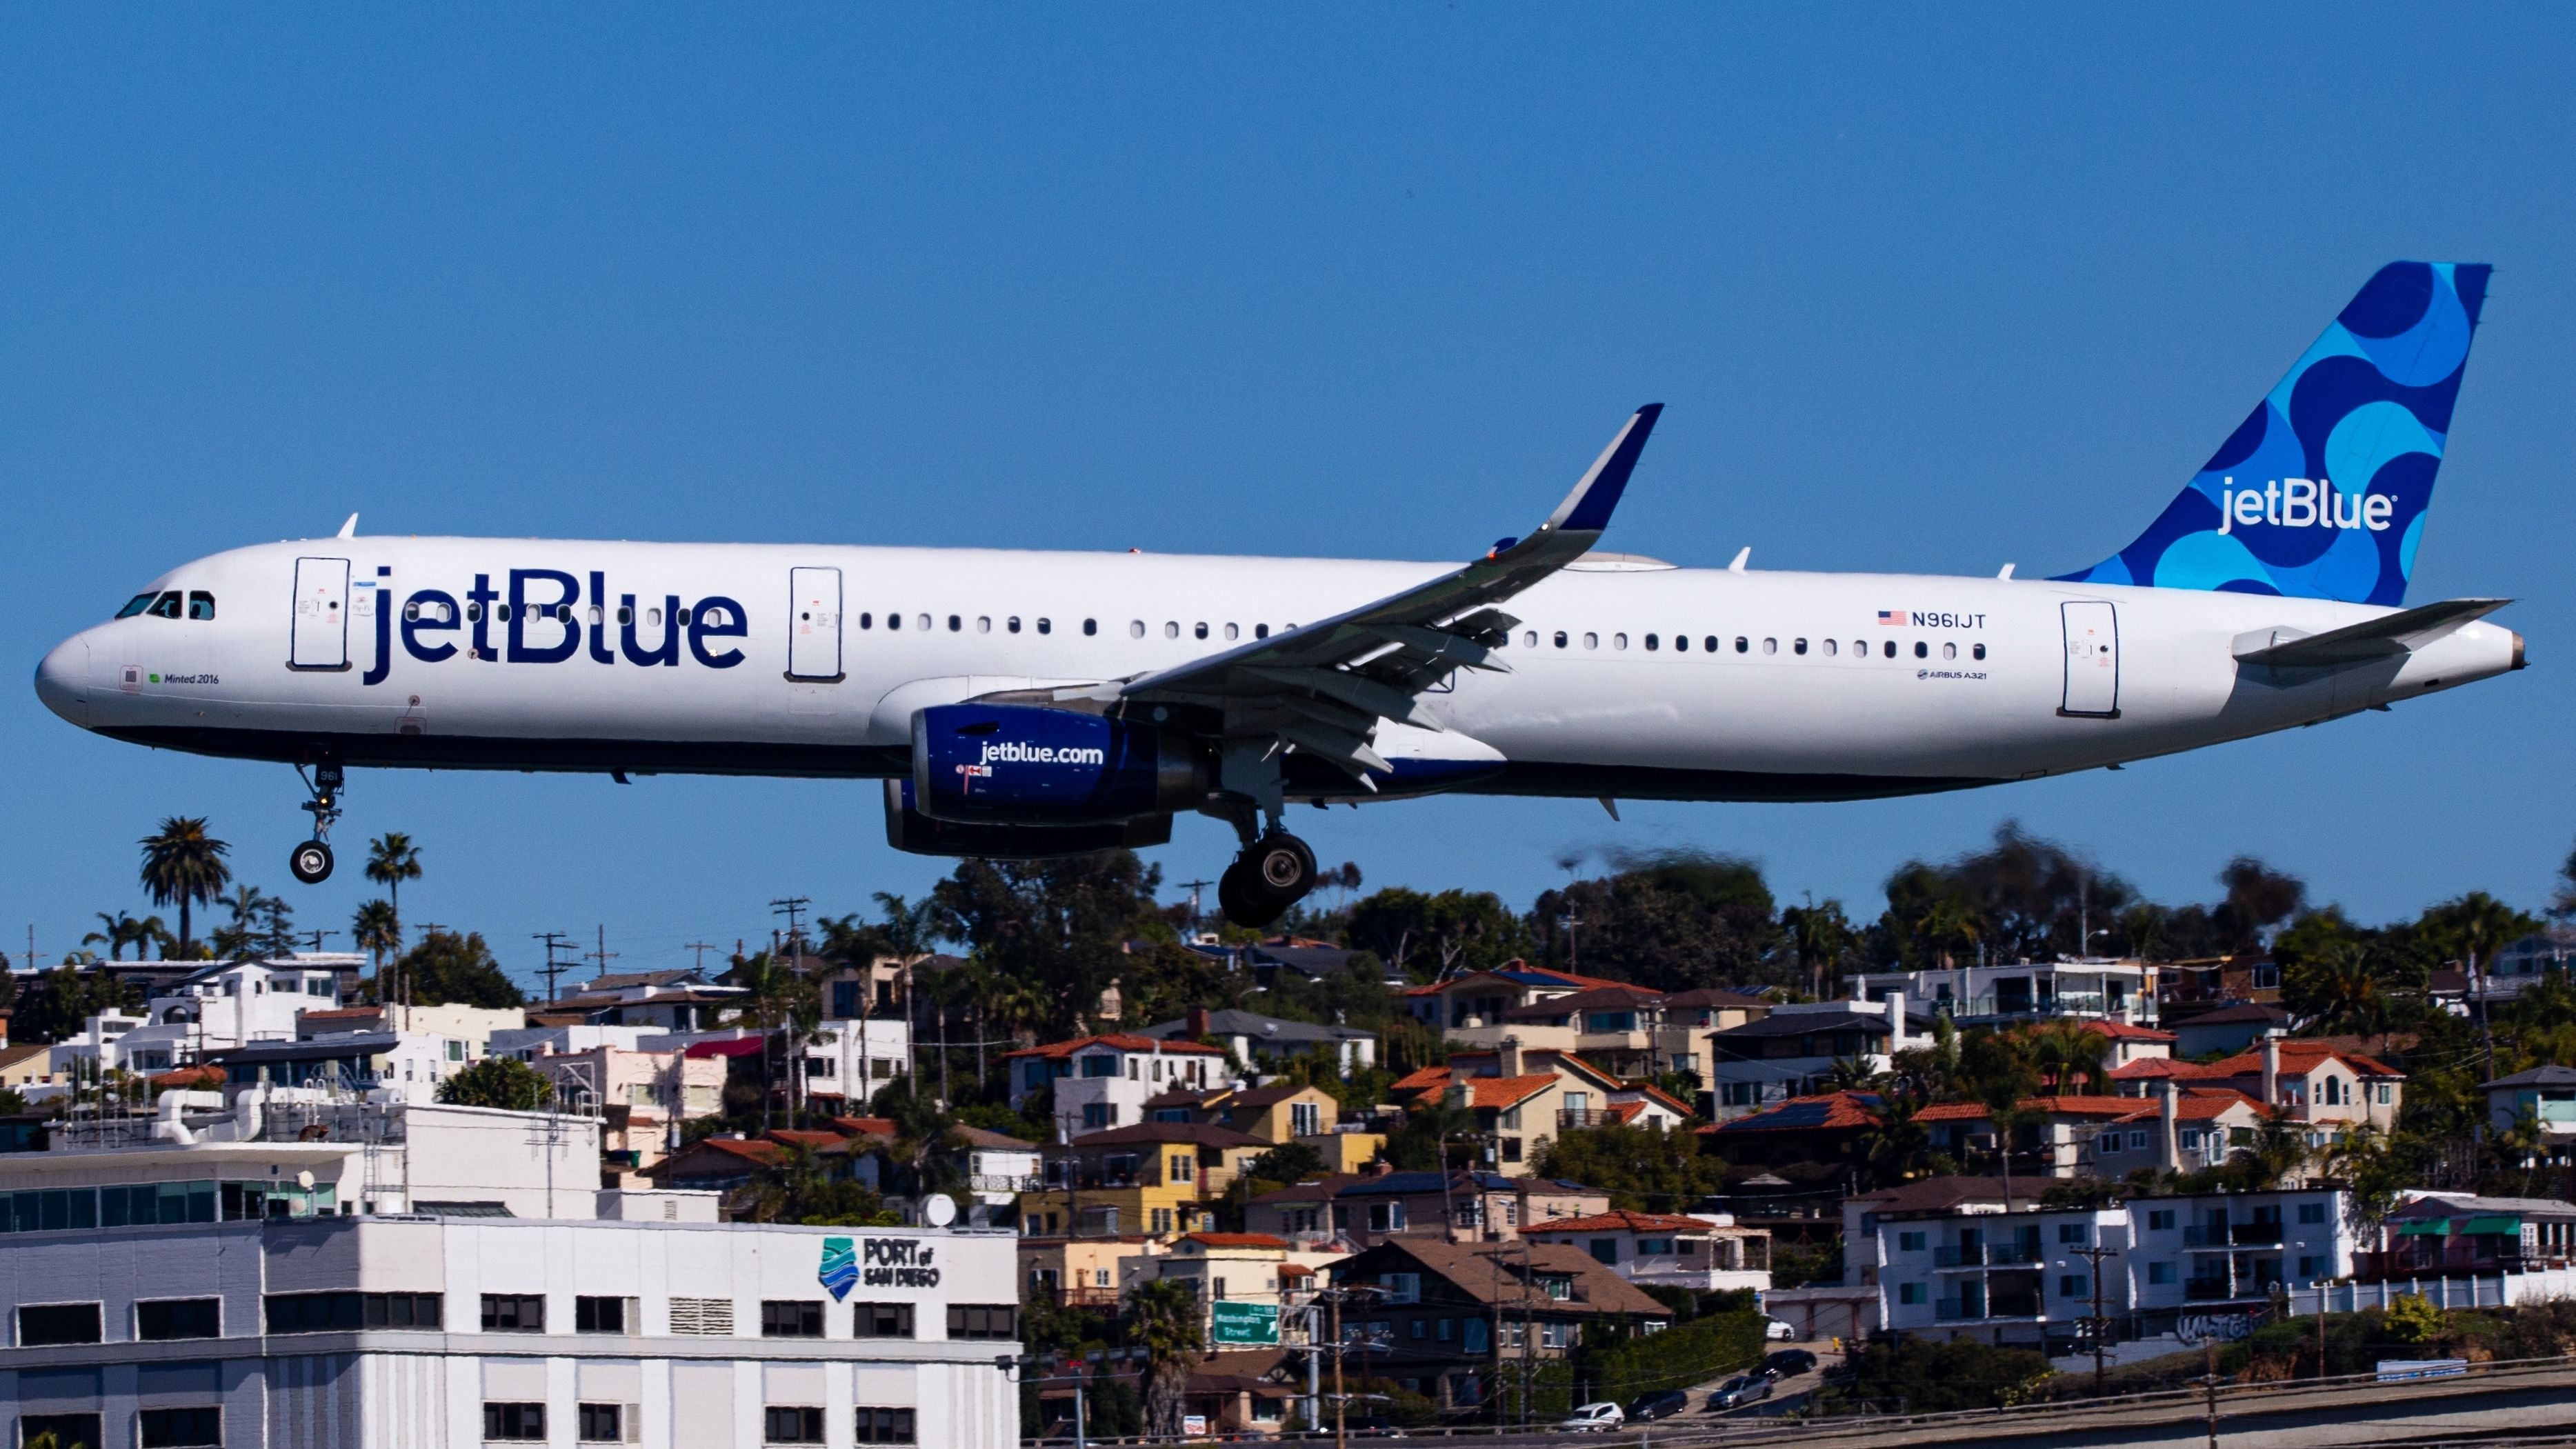
More than one in four of the carrier’s services are international, nearly double United’s share (14%), the carrier with the next highest proportion. Of course, JetBlue’s much smaller size influences this result.
Photo: Wenjie Zheng | Shutterstock
While the comparison is unfair, United has nearly three times more international flights than JetBlue. Some of United’s services are on its low-capacity, high-premium, 167-seat Boeing 767-300ERs and others on its 787-8s and the 364-seat 777-200s.
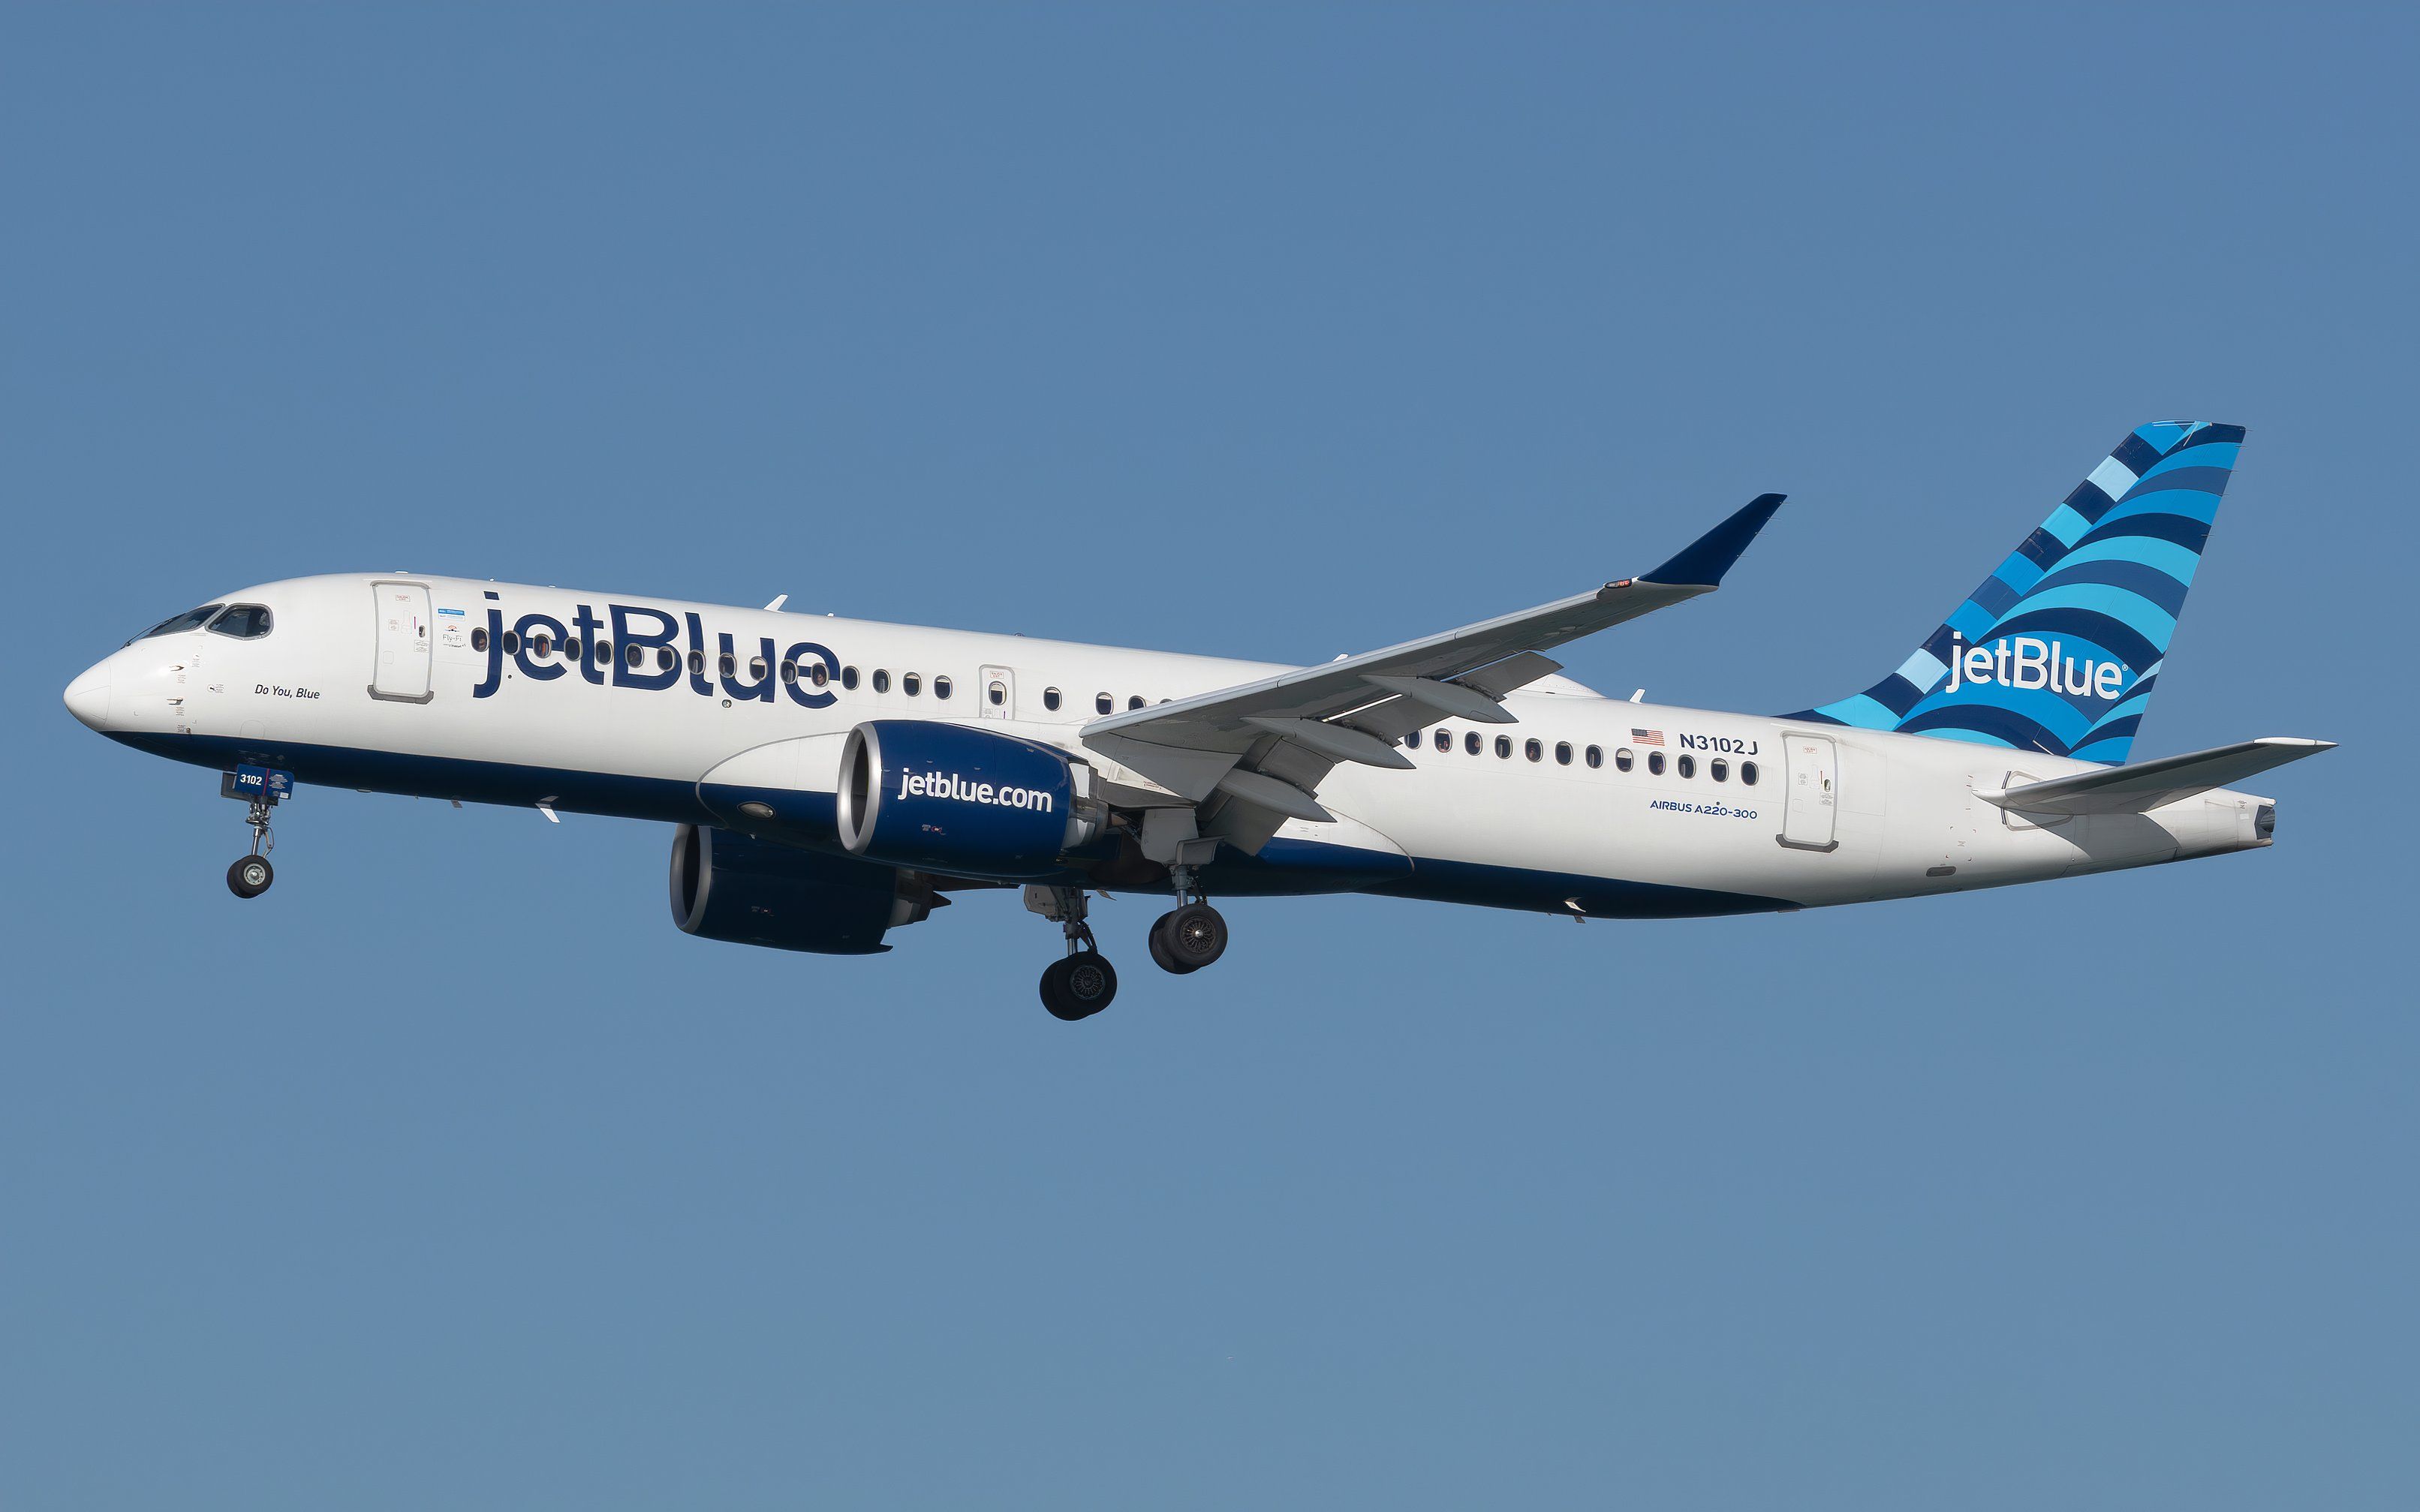
JetBlue’s well-discussed woes—it even lost money in Q3—continue. It is undertaking many changes to address its position, which has, among other things, involved removing numerous airports and routes from its network. These included the long-served New York JFK to Burbank and Ontario, last served at the end of October.
Photo: Vincenzo Pace | Simple Flying
International is up; domestic is down
Despite or because of JetBlue’s changes, schedule analysis shows it had more international service in November 2024 than in any other November. These services have risen by 2%. In contrast, the domestic market has seen one in 10 flights cut year-on-year, contributing to the international share jumping to 26%. Will it have the desired effect?

