Summary
- Global airline seat capacity has rebounded to almost pre-pandemic levels, with only a 0.8% difference from 2019 numbers.
- Southeast Asia, Eastern Europe, Southern Africa and the Southwest Pacific are still significantly behind in capacity.
- Central Asia is leading the way with a capacity of 41.9% higher than 2019, followed by North Africa, Central America, the Caribbean, the Middle East, and South Asia, all showing positive growth.
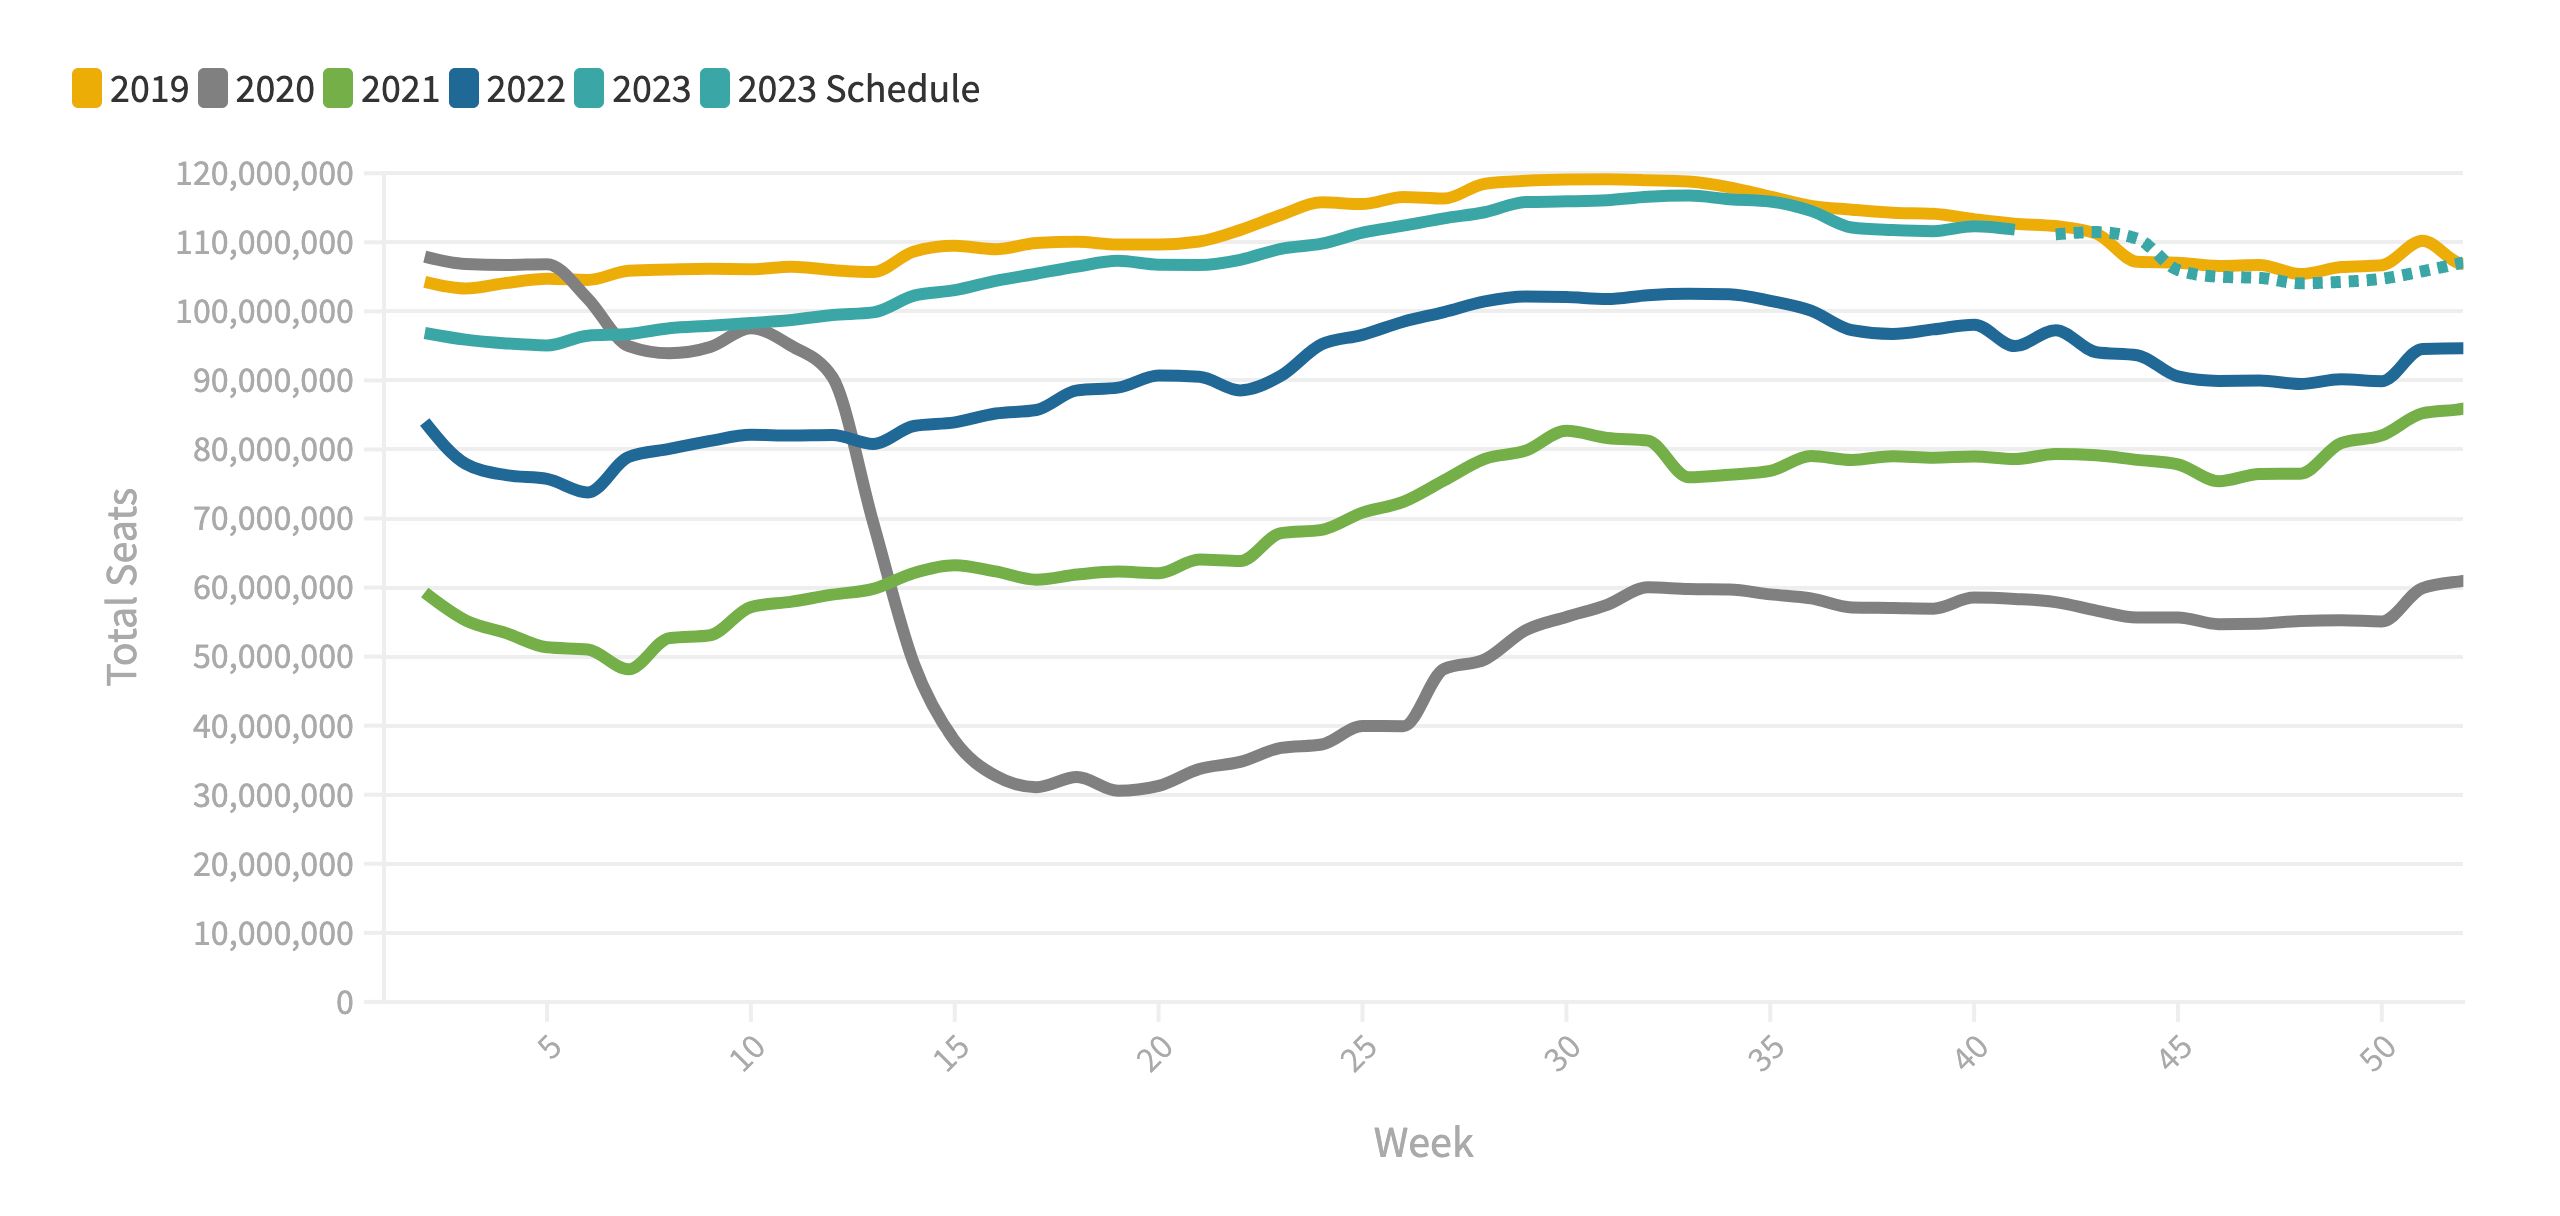
Over the last four years, airline seat capacity has been on something of a wild ride, although the only stomach-churning fall was in 2020 between the start of March and the end of April. In that period, global seat capacity fell from 97.5 million weekly seats to 31.0 million in just seven weeks.
There’s room for capacity growth in Asia
The recovery has taken more than three years, but this week, data from OAG shows that global capacity is sitting at 111.8 million seats, just 0.8% behind the same period in 2019. OAG forecasts that capacity is expected to settle at around 105 million weekly seats from the start of the IATA Winter season, which is 1% below the pre-pandemic winter of 2019.
Chart: OAG
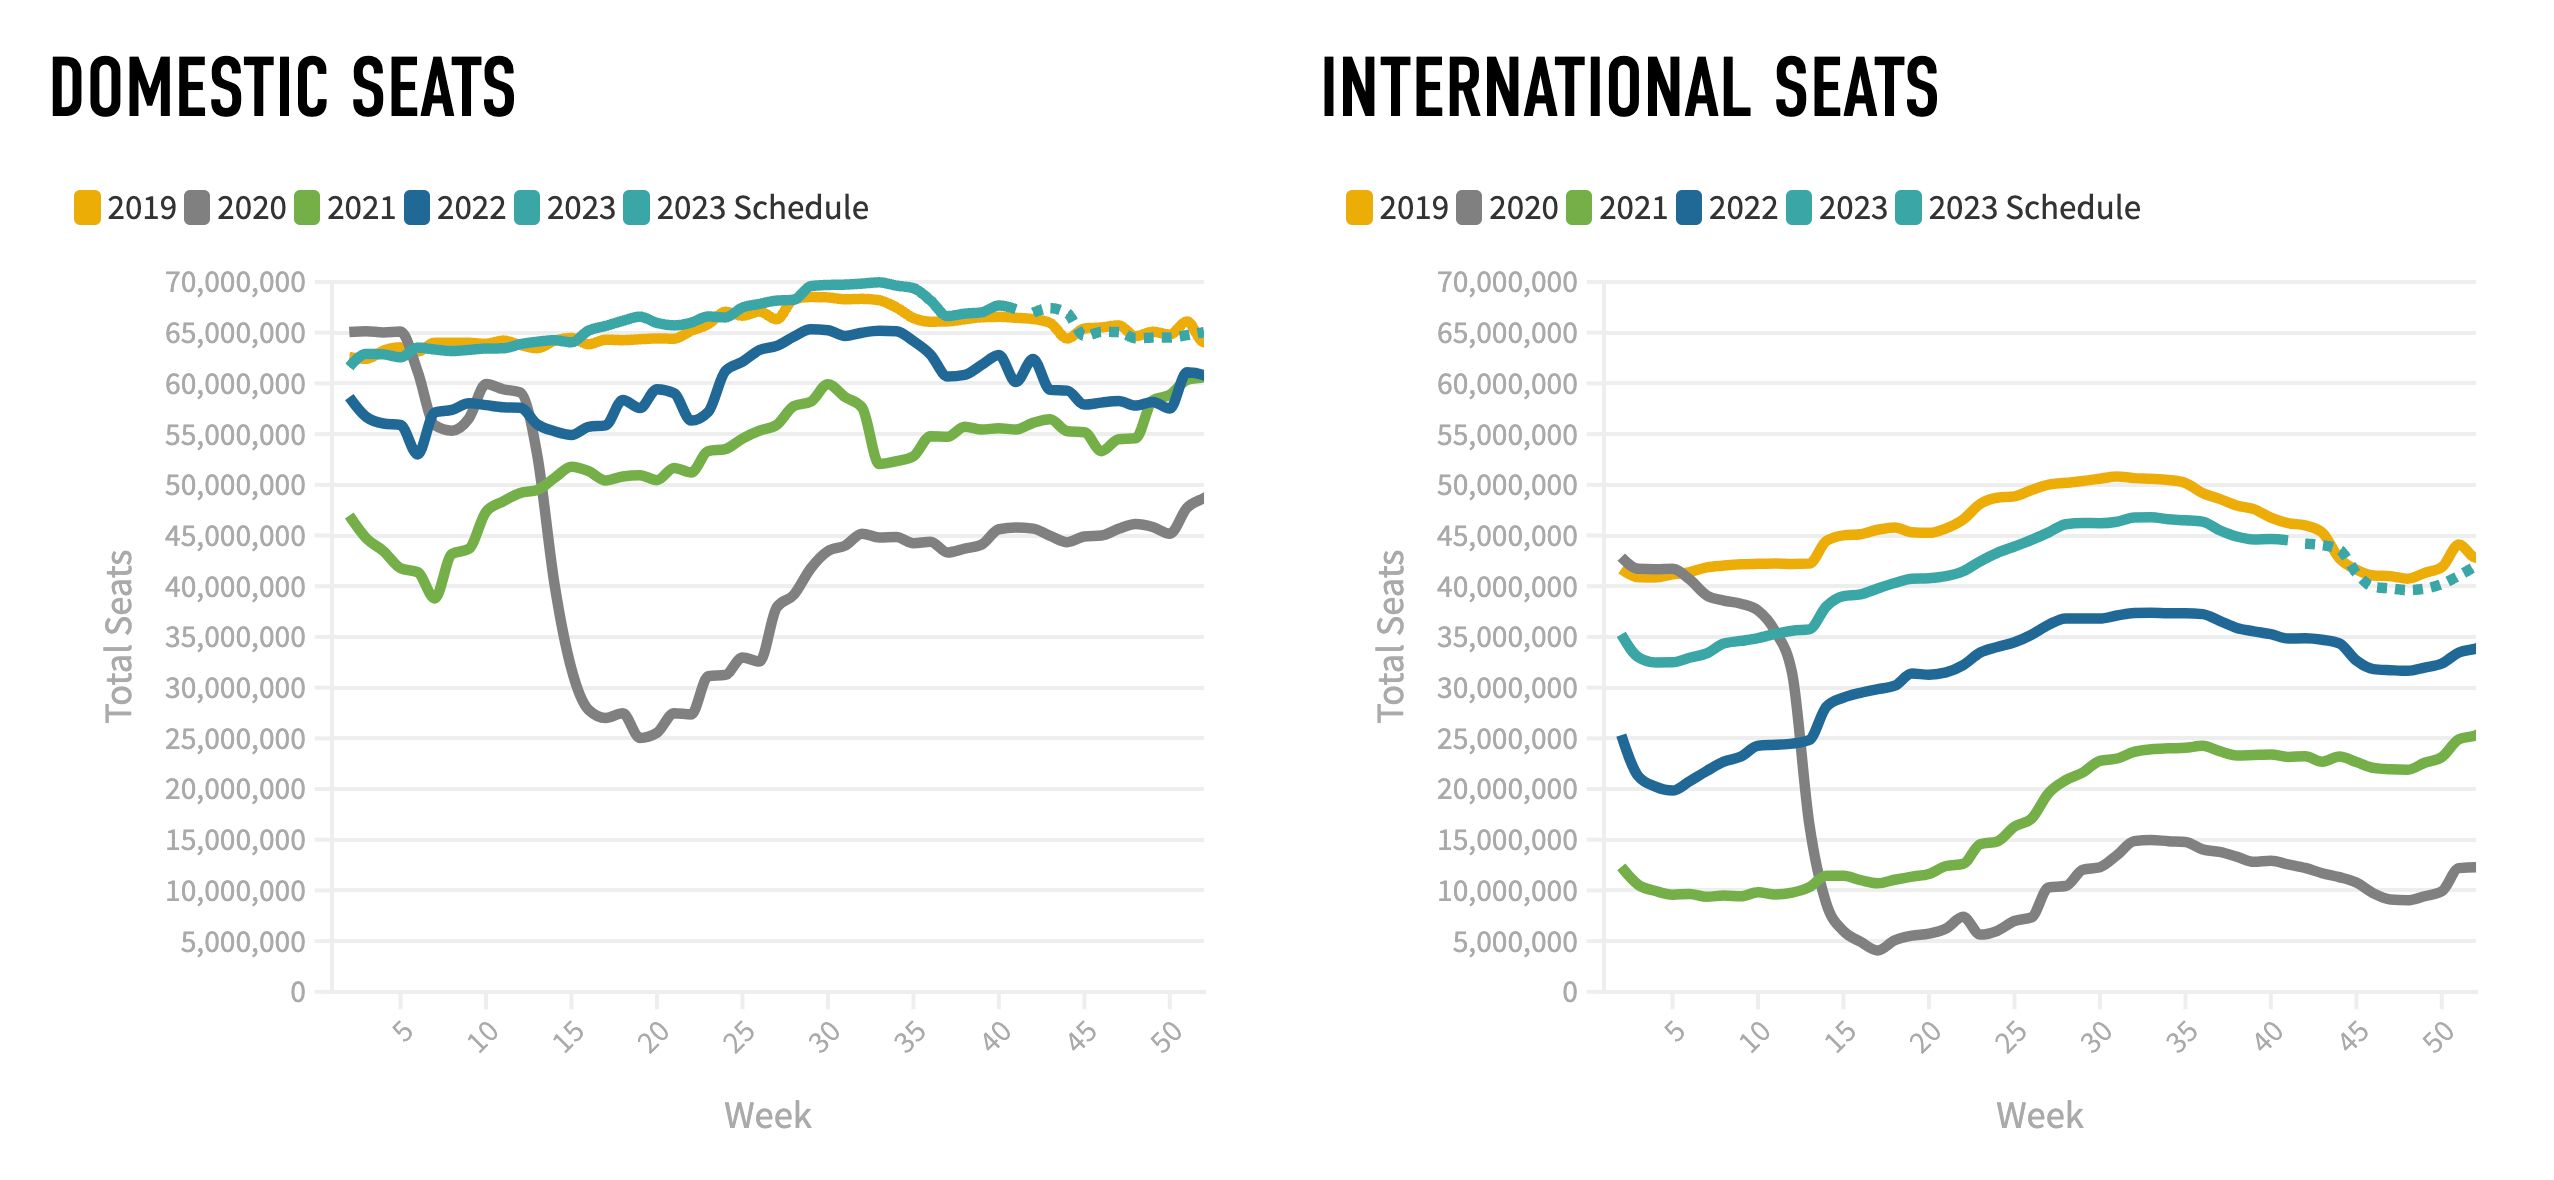
This chart is updated weekly with the latest capacity and the filed scheduled capacity for the eleven weeks ahead, showing an overall three-month forecast. Domestic capacity dipped by 0.5% this week to 67.3 million seats, although it is 1.3% ahead of the same week in 2019.
International capacity is at 44.5 million seats this week, 0.3% down on the previous week and 3.7% behind 2019 levels. The gap between 2019 and 2023 has narrowed in recent weeks, closing from an average of around 6%. OAG forecasts that international capacity will level at 40.4 million seats and domestic capacity at 64.7 million.
Chart: OAG
Southeast Asia is the outlier
While global capacity is virtually fully recovered to pre-COVID levels, four regions are still significantly down on 2019 seat numbers. Leaving out small weekly fluctuations, Southeast Asia has 19.1% fewer seats this week, Eastern Europe 15.8%, Southern Africa 12.2% and the Southwest Pacific, which includes Australia and New Zealand, is down by 6.7%.
Photo: PANUMAS PIX | Shutterstock
Within those numbers, Northeast Asia has 11% more domestic seats on offer but 29.3% fewer international, while Southeast Asia’s domestic capacity is down by 19.7% and international by 18.3%. In the Southwest Pacific, international services have reduced capacity by 12.1%, and domestic is doing far better at just 4.4% behind 2019 numbers.
Northeast Asia was the last region to emerge from border restrictions, and major airlines in the region are adding more international capacity now that group tourism has returned. The outlier is Southeast Asia and, to a lesser extent, the Southwest Pacific, which combined paints the Asia-Pacific region as continuing to lag the rest of the world’s aviation recovery.
Photo: Airbus.
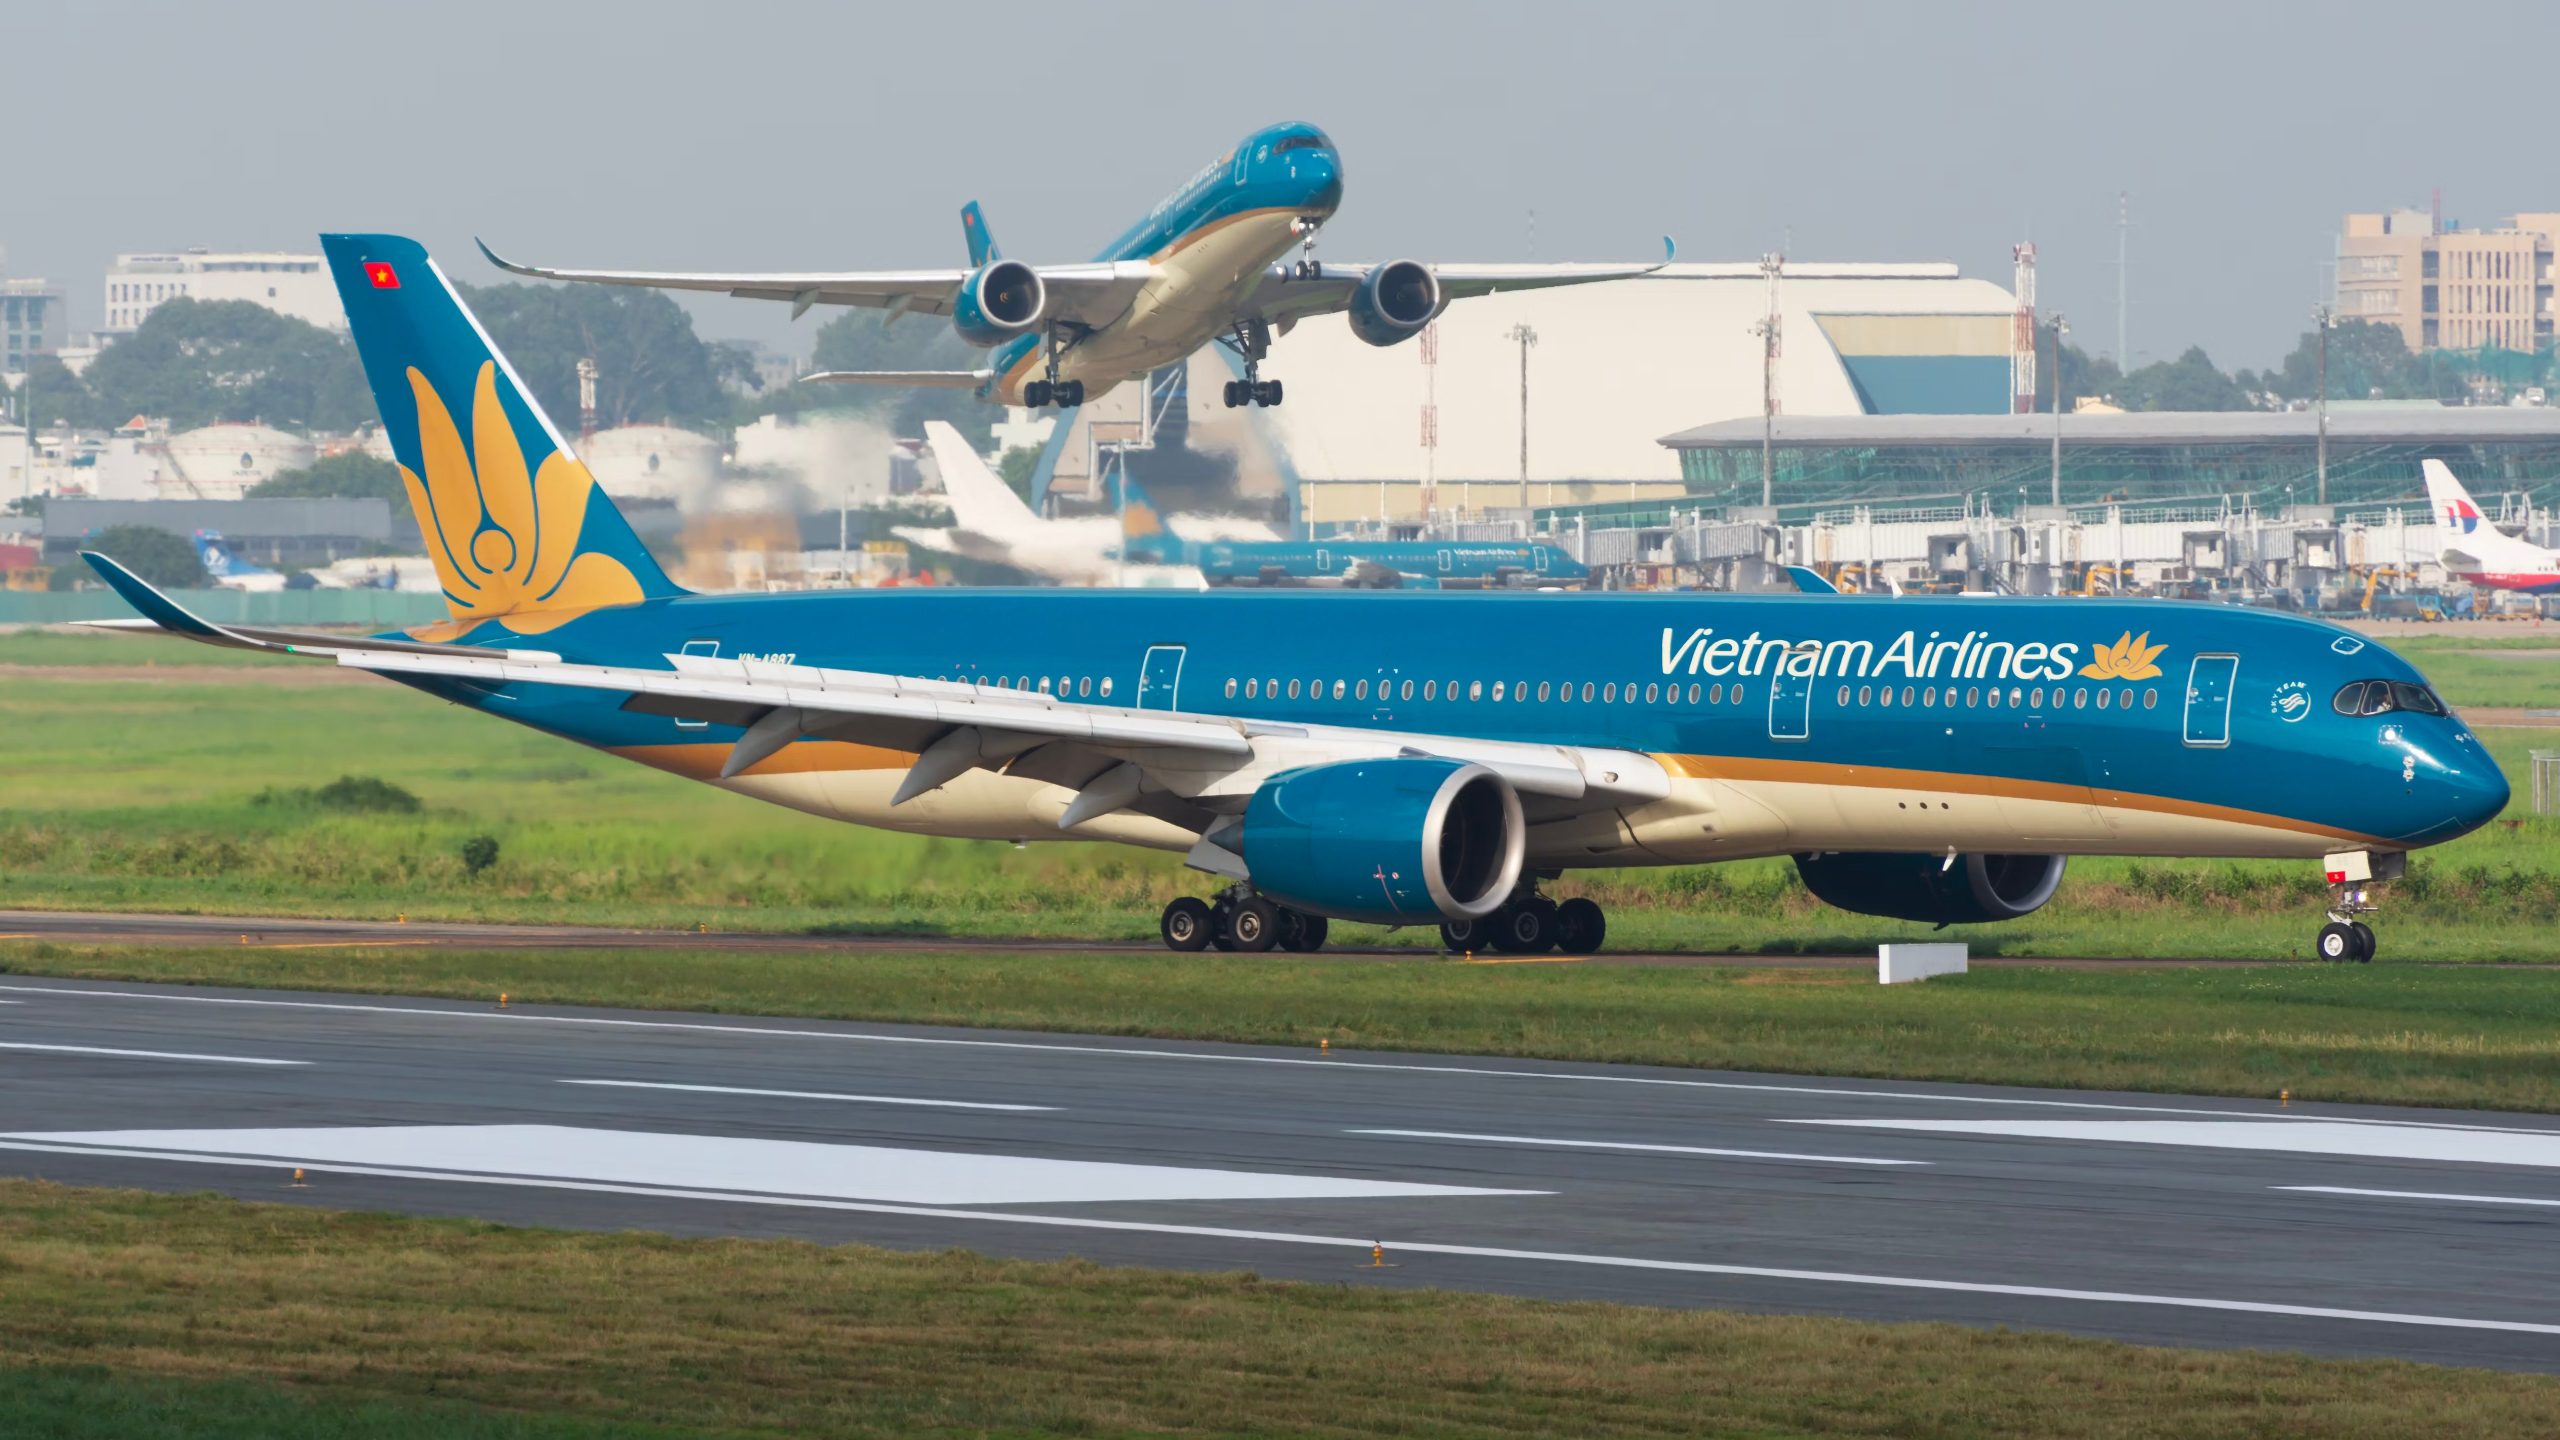
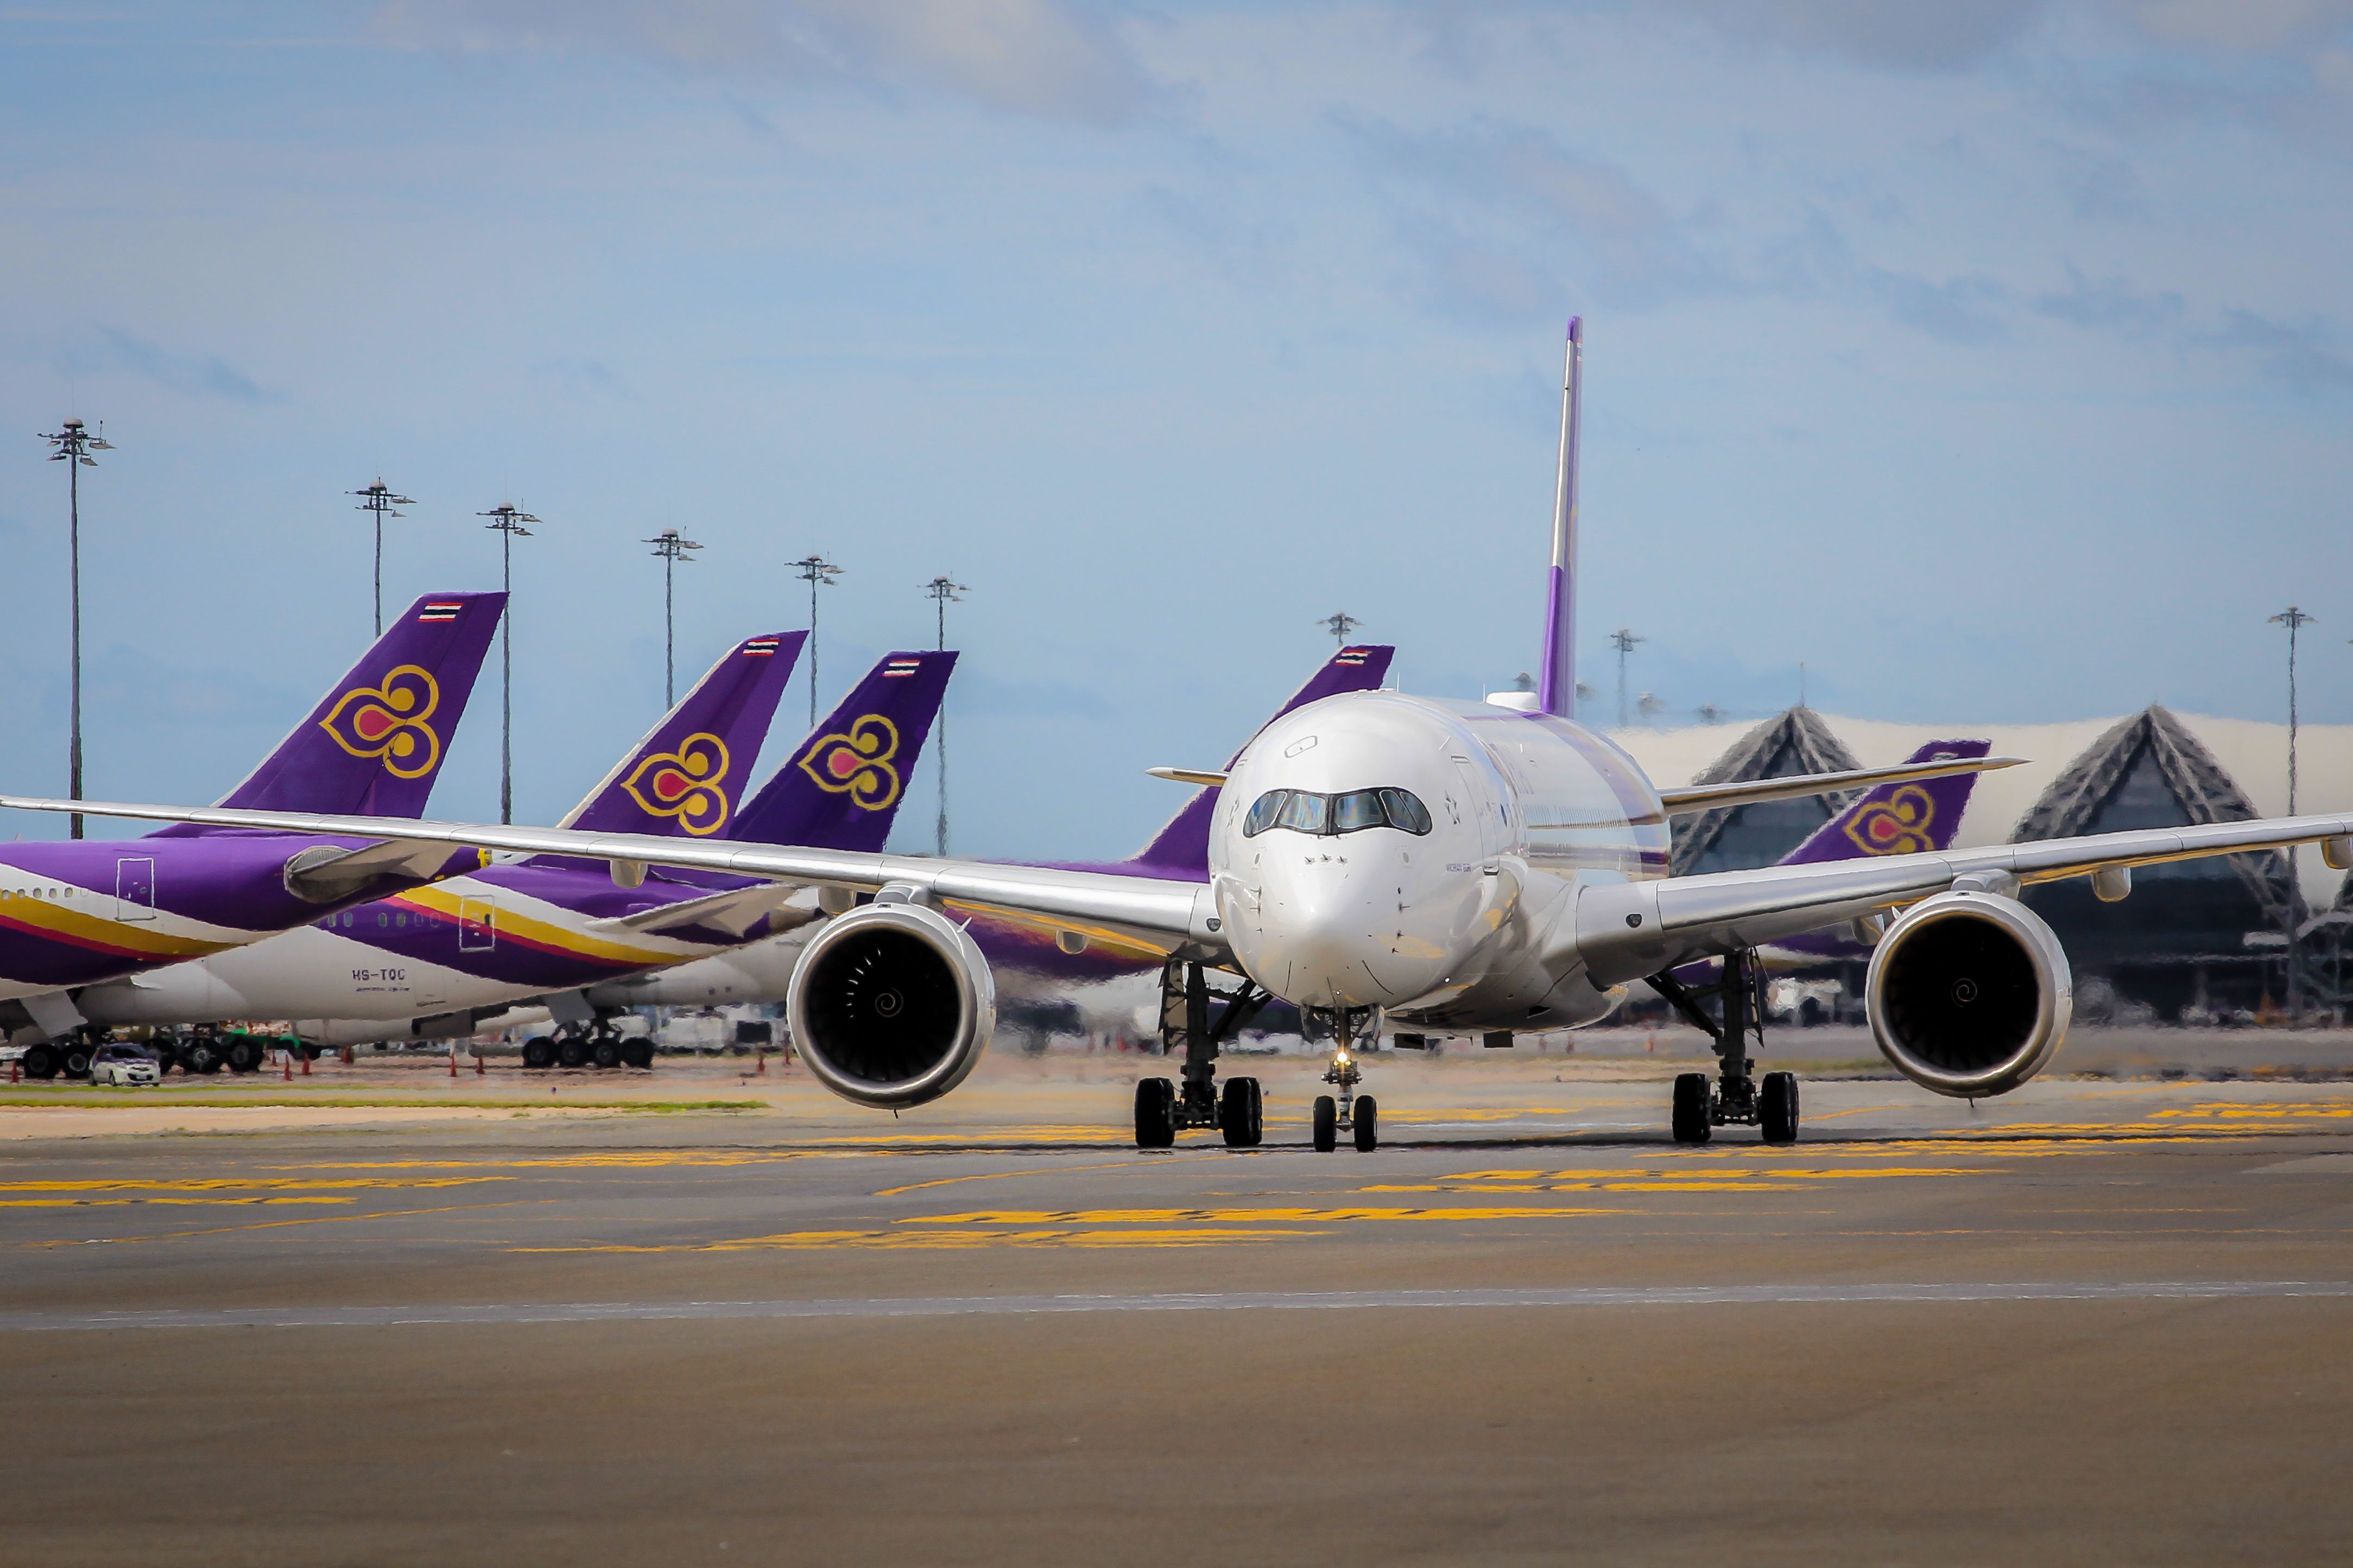
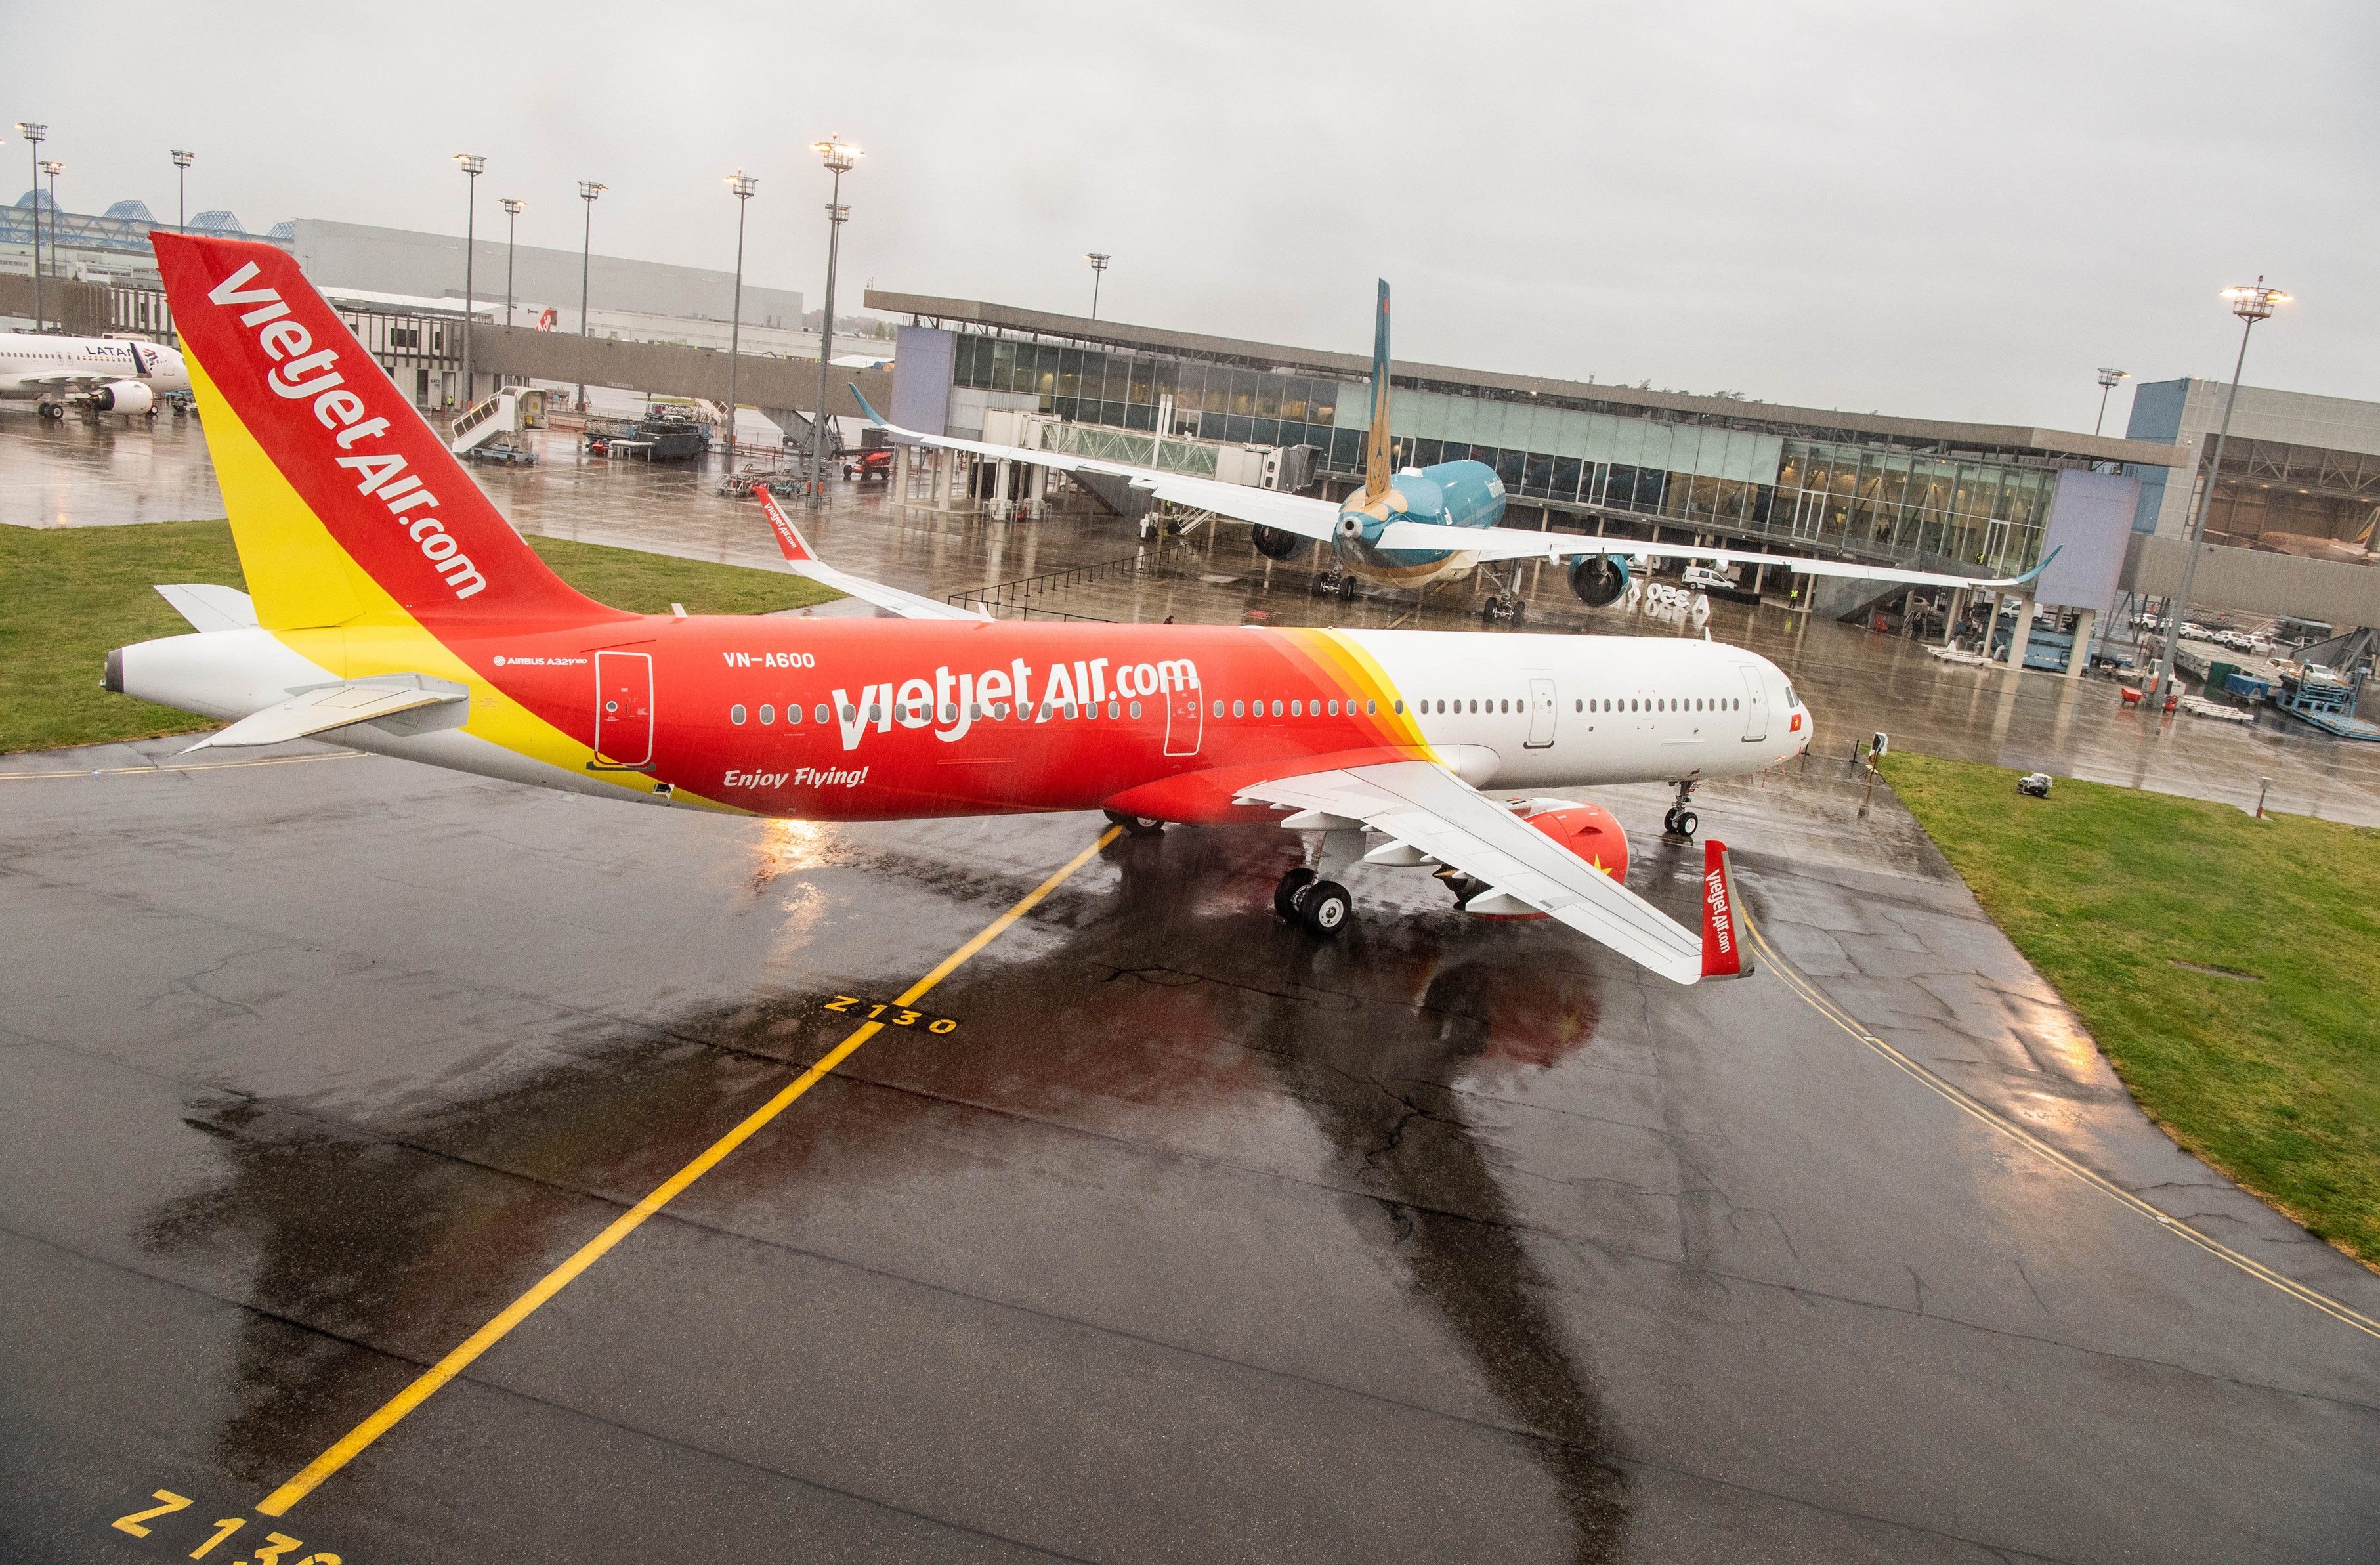
In September, OAG reported that Vietnam was the only country in Southeast Asia with capacity within single digits of pre-COVID levels, with 3.4% fewer seats. Around the region, the picture looks like this: Singapore -10%, the Philippines -11.1%, Indonesia -16.9%, Malaysia -19.7%, Thailand -26.8%, Laos -35.6%, Myanmar -50.6% and Cambodia -57.7%. In the Southwest Pacific, Australia had 4.2% fewer seats and New Zealand 6.9%.
On the optimistic side, airlines in Central Asia are leading the way with a total capacity of 41.9% ahead of 2019, followed by North Africa (+23.2%), Central America (+13.9%), the Caribbean (5.4%), the Middle East (5.1%) and South Asia (4.5%). In North America total capacity is ahead of pre-pandemic volumes by 2.1%, while Upper South America is 4.2% up, and Western Europe is close to par at -0.1%.
Are you happy to see seat capacity returning to 2019 levels? Let us know your thoughts in the comments.
Source: OAG

